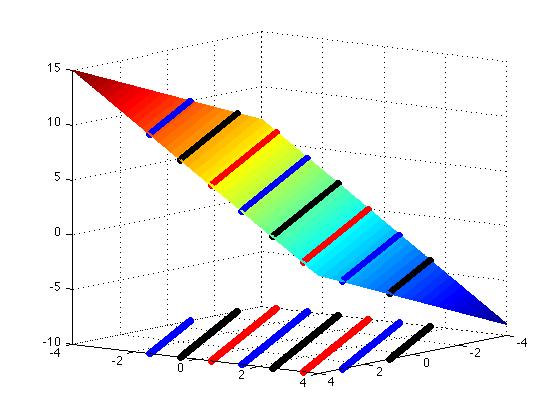
This is a graph of the surface z = x - 2 y + 3 using MATLAB. The lines in
the x-y plane are level curves (from left to right, starting with the blue
line c = 10, c = 8, c = 6, c = 4, c = 2, c = 0, c = -2, and c = -4. Each
line is also shown moved up to the height z = c.
If you have MATLAB and want to graph it yourself, here's the
MATLAB code