The Formation of a Black Hole
If a massive star burns out but cannot support its matter against the force of gravity, a black hole forms. This means that the star collapses to a single point called the singularity. The singularity is a place of infinite gravitational forces and is surrounded by a boundary called the event horizon, inside of which light cannot escape. The animation shows an embedded spacetime diagram of a spherical star shrinking in radius. If the star keeps the same mass, then the geometry outside the star remains the same; what we are seeing is more of the curvature being revealed. In other words, the mass (not the radius) of the star determines the how spacetime is warped around it. We get a black hole when the star is so dense (think small and heavy) that the star can "fit" through its own ripple in the fabric of the universe.
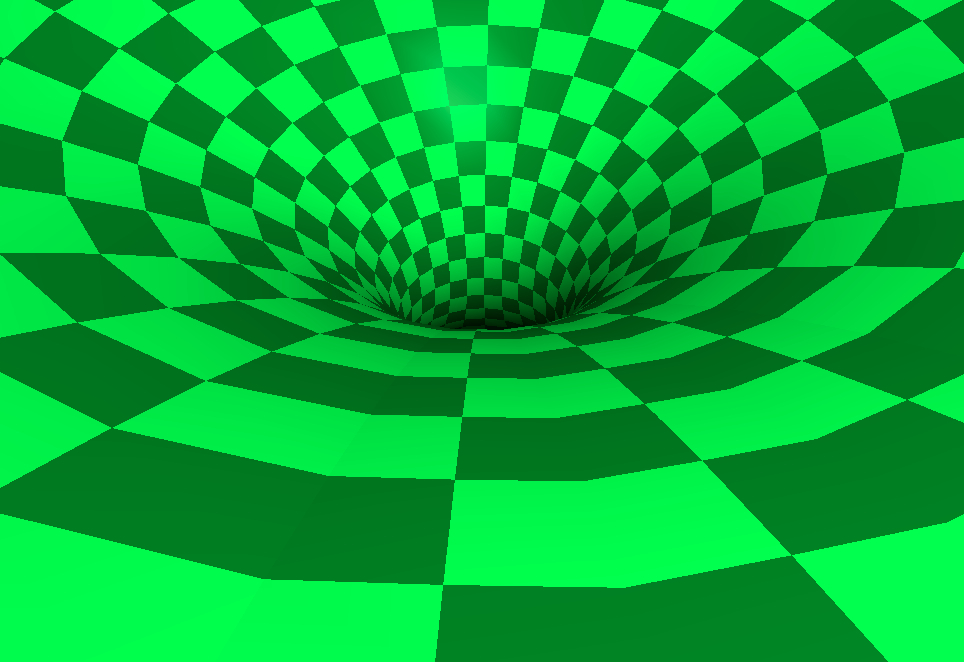
Click on the pic to see animation