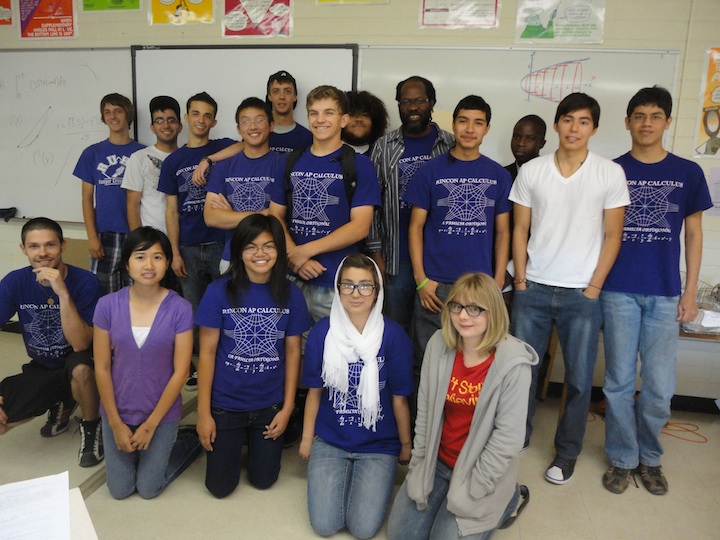
Rincon AP Calculus: "la familia orthogonal"
Click on title headings below to expand/collapse.
For this academic term (2010-2011), I've been awarded a G-TEAMS fellowship. In its second year, this NSF funded program pairs up STEM students (graduate students in science, technology, engineering, or mathematics) with K-12 teachers to create a mutualistic symbiosis in which each party shares "different perspectives and expertise." You can find out more about the program at this link. My personal view on the program objectives also includes a deeply motivated interest in improving math (and science) education in a wonderful country which is (in spite of having plenty of resources) woefully behind other developed nations in those areas. Let's get down to brass tacks. We have no great reserve of natural resources to export much less to sustain our own energy consumption... in fact, it seems that a chief export is industrial jobs (e.g., see Michigan). With that in mind, what then can we contribute to the world? We have our minds, our innovation, our leadership. Quality education for our youth is therefore an imperative. One problem seems to be that we cover many topics marginally for many years instead of focusing on a few core ideas and moving on. It's like Larry, Moe, and Curly repeatedly trying to walk through the same door at once and getting stuck. Why does this happen? Our children's textbooks are gargantuan partly because each state, each city, each district wants its own topics attended to, so the publishers must find a way to accommodate. How easy do you think it is for a teacher to parse through all that material and pick out pieces of every sentence to extrapolate a coherent yet compact course of study? One way of rectifying this is to have common core standards. A draft of some new common standards has been in the works and you can take a look at them via this link. Of course, not all states are equally fired up about adopting the new standards, and the standards themselves do not constitute curriculum. Nonetheless, it seems to be a step in the right direction. Another issue is that there is a major disconnect between mathematicians doing research/teaching at the college level versus the math educators in the trenches at elementary, middle, or high school levels. The reason for the existence of this chasm is likely tangled up in a combination of monetary incentive, research opportunity, and prestige. This program might be thought of as a way we can start to build the bridge. In particular, not only are grad students supposed to continue their own research, but we are encouraged to find ways of introducing it into the classroom. That's easier said than done considering the background needed to even begin research, but we do have a tremendous amount to offer in terms of concepts and advanced viewpoints that might be absent (or even discouraged) in a traditional setting. We can challenge, inspire, and facilitate.
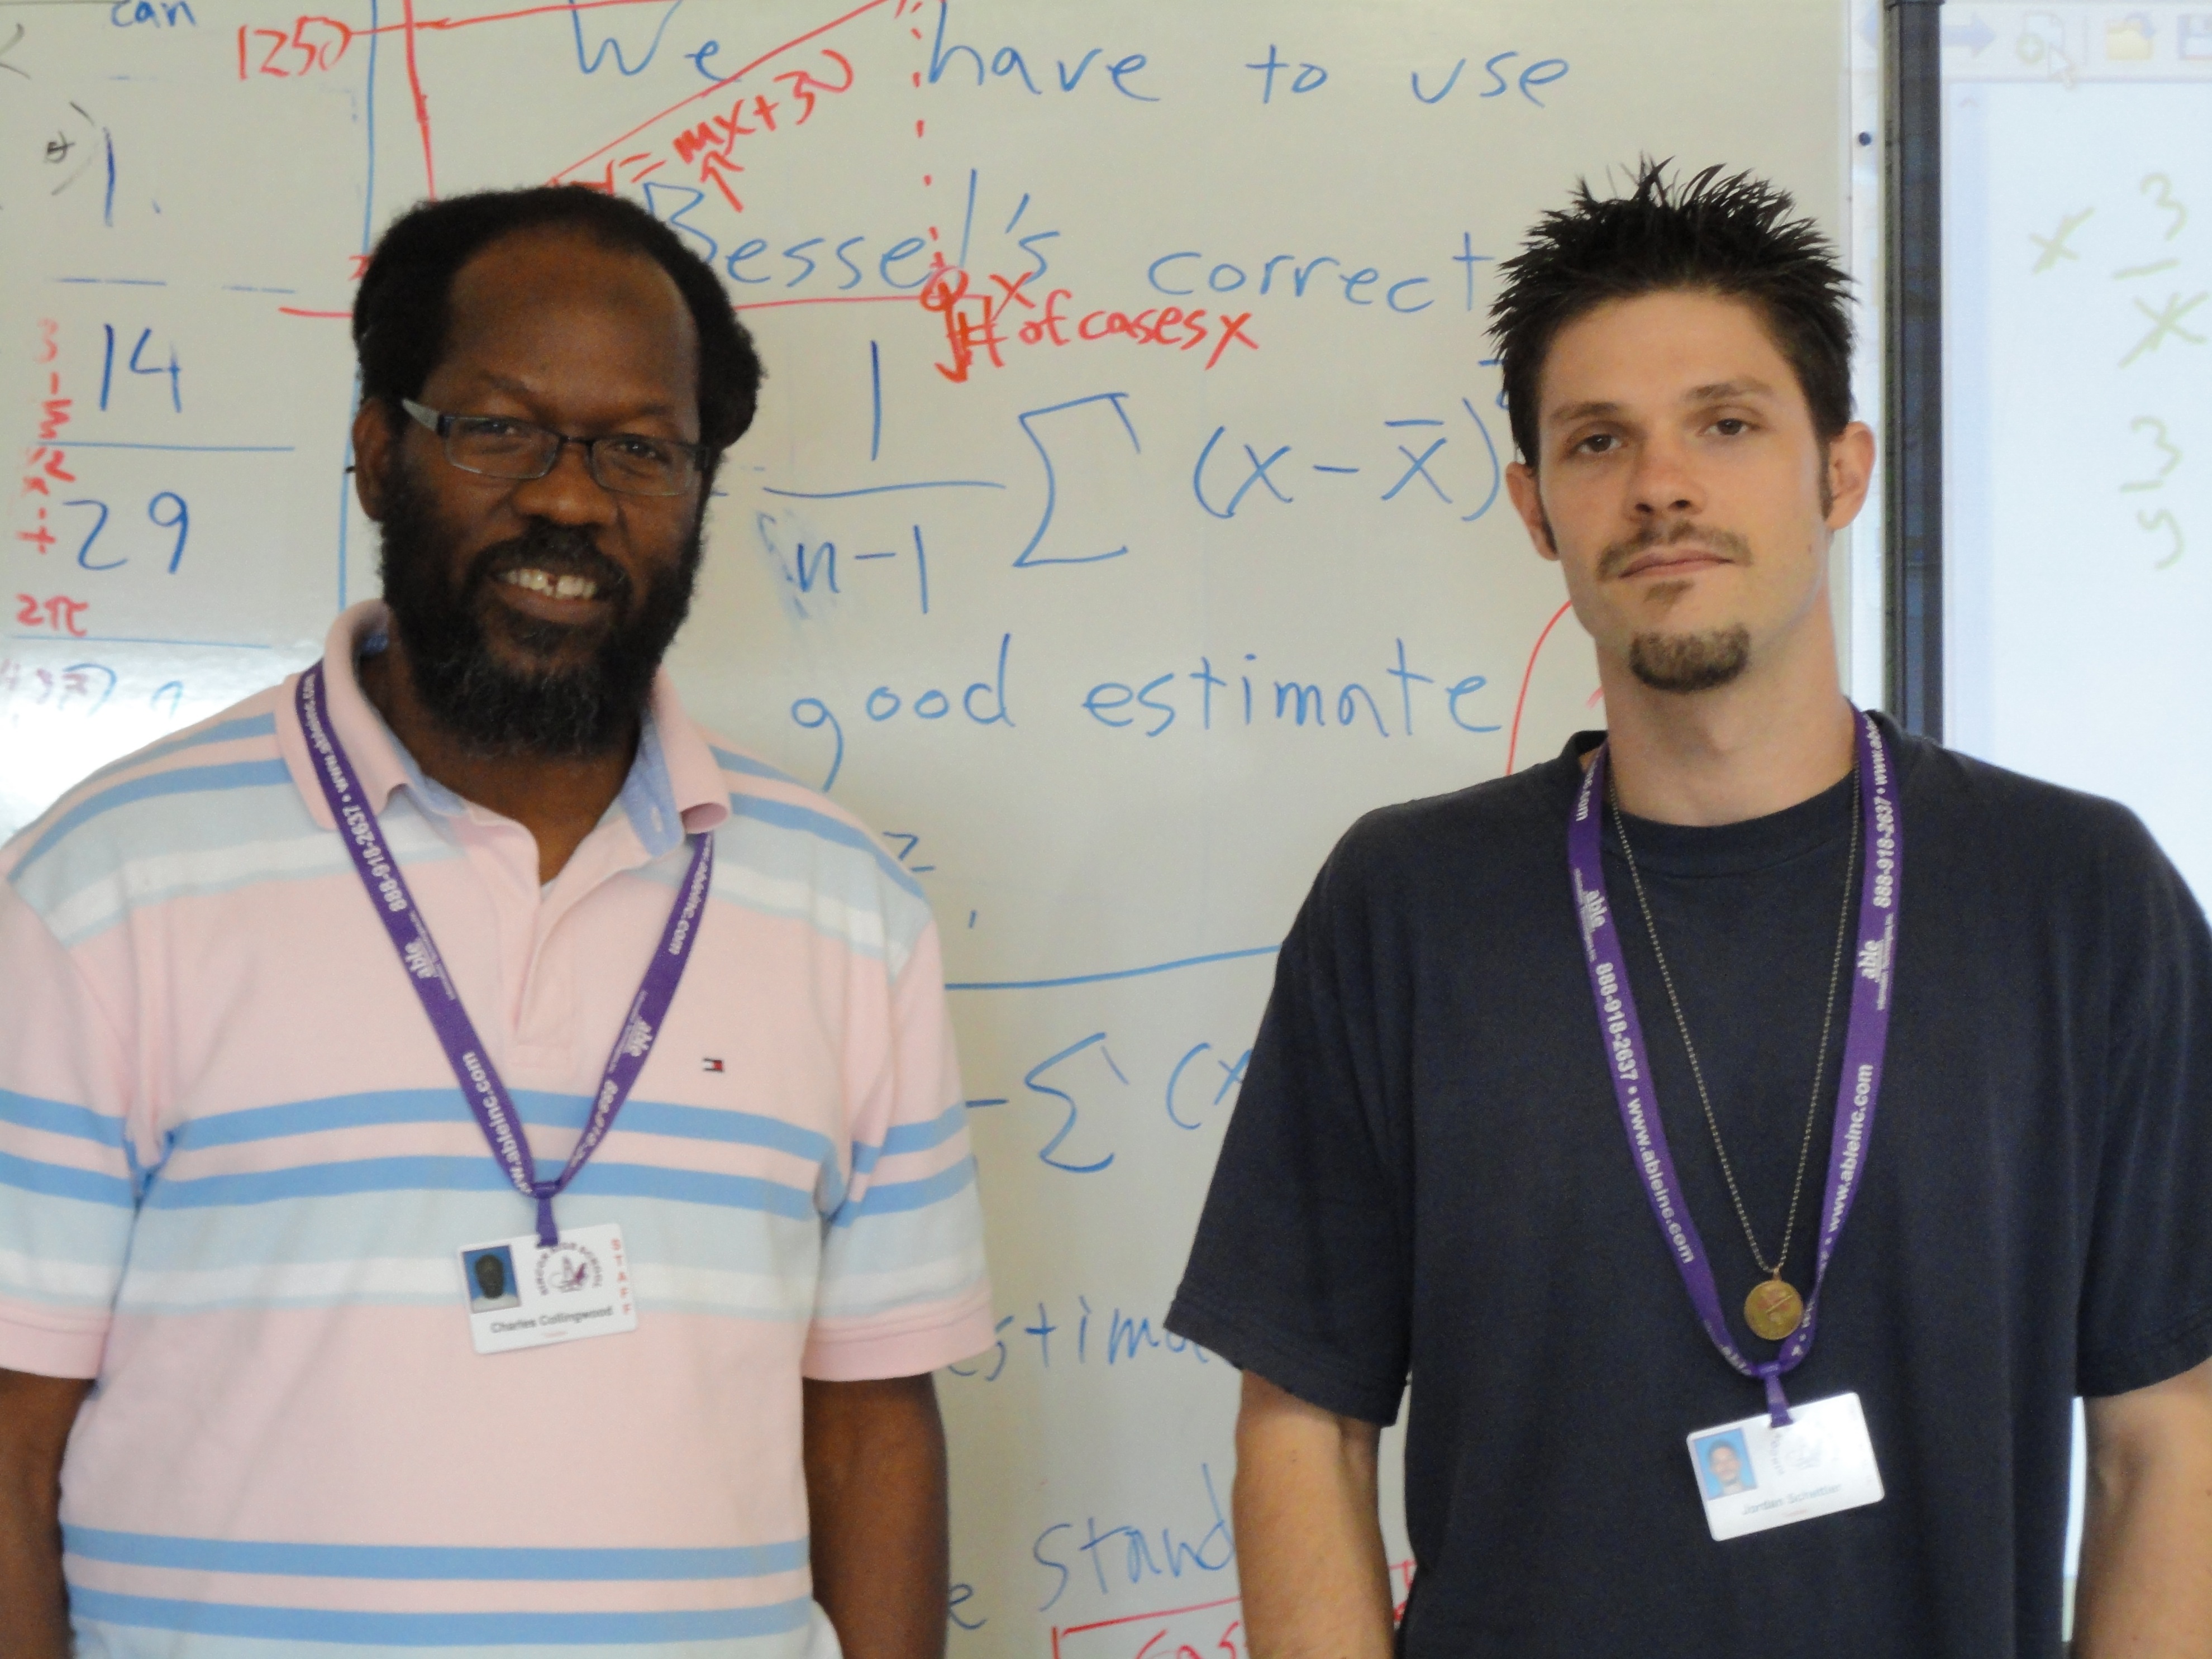
I'm extremely fortunate to be working with Charles Collingwood at Rincon High School. Charles wrote a wonderful essay when he applied, and partly by luck we were grouped as a potential match. I read his essay and agreed with everything in it, so I gladly accepted the grouping. As the year moves along, you'll be able to read about the projects and activities we cook up for the students, but the common themes we'll try to incorporate are social justice, environmental responsibility, current scientific research (particularly involving mathematical modeling), and those things in life which are just inherently interesting (like black holes or transcendental numbers, for example). Generally speaking, the culture of math in this country is troubling. There is fear, dislike, and an attitude of accepting (less than) mediocrity. We'd like to be part of changing perceptions of what math is and how math should be taught. I've included a picture of Charles and I below.
Charles and I first met face to face at the beginning of the summer (2010) when I arranged to come visit one of his pre-calculus classes a week or so before the spring semester ended for TUSD. The students were arranged in clusters of four (an idea which would have been my first suggestion had it not already been in place all year), and they were studying the "Gini coefficient" as it pertains to inequality of income. Here's the basic scoop: for a given country we define the Lorentz curve to be the graph of the function L which assigns to each percent x the percent L(x) of total income for the country which is taken in by the lower x percent of the population ordered from lowest to highest income taken in. For example, as of 1998 in the United States we had roughly L(80%) = 50.6% and L(20%) = 3.6%, meaning that the richest 20% took in almost half of the total income while the poorest 20% took in less than 4% of the total income. One can analyze this with respect to other measures (like wealth instead of income) too. Sticking with income, if we looked at a country with uniform distribution of wealth, then we would have L(x) = x for all x. This is called the line of perfect equality. In general, L(0%) = 0%, L(100%) = 100%, and the Lorentz curve lies under the line of perfect equality. The graph below illustrates a generic situation.
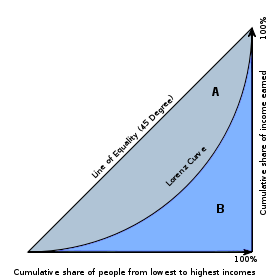
Since we want to measure how close the Lorentz curve is to the line of perfect equality, it's appropriate to consider the Gini coefficient defined to be the ratio G := A/(A + B) of the area A between the line of perfect equality and the Lorentz curve to the area A + B = 1/2 between the line of perfect equality and the x-axis. In this way, G = 0 means that there is no inequality while the closer G is to 1 the more inequality there is. Note that G = 2A = 1 - 2B, so to find the Gini coefficient it suffices to compute the area B between the Lorentz curve and the x-axis. This is where the calculus comes in... if we have a nice function L(x), then the desired area is the integral
∫[0, 1] L(x) dx = B
which (if L(x) has an antiderivative) can be computed with the fundamental theorem of calculus. When I heard the kids discussing the meaning of the Lorentz curve, Gini coefficient, and the concepts of integral calculus, I knew that Charles and I would have a lot of fun and productivity working together. We met again at the G-TEAMS summer institute where we got a feel for how we would work together and what our priorities in teaching were. A strong moment was when we came up with a lesson together and presented it to the group. I proposed the idea of using algebra tiles to calculate remainders in polynomial division, and Charles added to this by noting that at each stage of tile manipulation there was a corresponding step which showed up in the traditional long division and that this correspondence could be used effectively to teach the abstract from the visual.
After the G-TEAMS institute, Charles and I spent the better part of a week together attending the 12th Annual Institute for Transformative Education held at the Education Building on the UA campus. To say the least, the conference was inspirational, moving, and bordering on life changing. Some of the items touched on which I particularly enjoyed include eco-apartheid, opening up creative spaces for students, preservation of culture in education, and a galaxy of success stories which served as a bank of ideas for the things we could do with our own classes. During this time, Charles and I got to know each other better on a personal level as well as gathering socially relevant project ideas. One idea we'd like try in our stats class, for example, is to estimate the cost to BP of the oil spill cleanup by having students plot data on previous oil spills and then use linear regression to come up with a function which estimated the cost of a spill based upon the size (as you might expect, the cost per barrel goes down when the number of barrels goes up). I've included the following graph to give an indication of the trend.
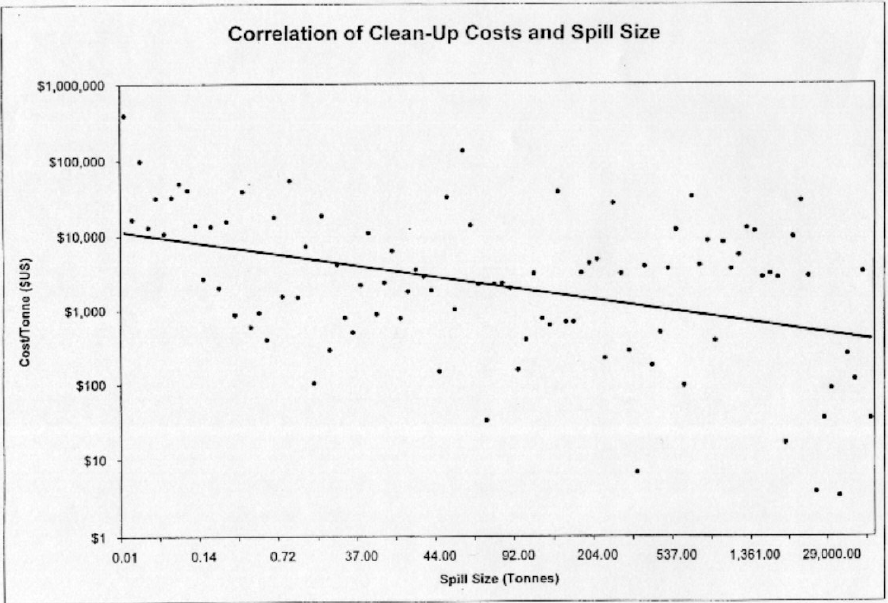
My friend and fellow grad student Geillan Aly added the following twist: why not also estimate how much BP makes in a year to see how long it will them to recoup their losses since there were reports that it would take only one year to do so (including all the money they would have to pay in damages as well). In general, our focus during this time was on the Statistics course we'd be teaching since Charles had not taught that specific course before and also because we saw it as a wonderful opportunity to be creative yet grounded in nearly every lesson we gave. At the end of the conference, I began work on an outline for the Stats course with the goal of reaching the χ2-independence test which I see as powerful tool to quantify a wide range of claims.
In the next few weeks, we met on several occasions to discuss more nuts and bolts issues like textbooks, precalc labs, access to computers (and the software on the machines available to us), and also the high bar we wanted to set in our AP Calculus class. The week before school started we met at Rincon every day to get the classroom ready: transporting books to and fro, discussing how the new calculators would be distributed, getting Rincon IDs made, taking care of the fingerprinting, getting a switch so that Charles and I both could have simultaneous internet access, and so on. In the same week, we planned out what we wanted to do during the first couple of weeks of school. Namely, we decided upon ice breakers and review material to help ease them into the school year as well as begin to create an atmosphere of group work. I spliced together some video clips using some software I purchased to show in our stats and precalc classes. The clips were chosen to challenge the students' perception of what math is and how math is taught. I also made a video for one of our fellow instructors at Rincon (Mr Shanton) which was a series of clips from "The Karate Kid"... the sequence is intended to show that as students we don't always see how the little skills we're learning will all come together. In the same week, Charles and I discovered that the department had just obtained an Avermedia video camera which connects to a projector via either S-video or vga. It serves the same purpose as an ELMO: one can project worksheets, textbooks, notes, etc, instantly, and one can freeze images, store them in a gallery or even send them to the Smartboard notebook for editing. I set it up and showed a fellow instructor (Ms. Crawford) how to set it up in her classroom.
"I don't need your civil war. It feeds the rich while it buries the poor..." Every institution has its fair share of politics involved, but Rincon may be overachieving in that respect. You see, the campus is shared by two schools. One of them is Rincon, a once performing-plus school which is now underperforming (according to the new guidelines) and is on the cusp of being in serious trouble. The other is University High School (UHS), one of the best schools in the country (recently in the top ten of the nation). The morality of the shared campus is debatable, but the idea is genuine enough: both schools are supposed to benefit from the other's strengths. There are Rincon students who take UHS classes and vice versa. That said, both schools must have the same bell schedule; they've tried superimposing different bell times, and that failed miserably. Like other schools, Rincon/UHS has gone back and forth between a modular schedule and a sequential schedule. With sequential, students go to each of their classes every day for about an hour apiece. With modular, there are two days a week when students attend only 3 of 6 of their classes, but they meet for longer periods of time. One could argue that modular allows teachers to do extended in-class projects. However, there are also a ton of arguments against modular: missing a modular day also means you've missed two days of material in those classes, there is a literal loss of instructional time on modular days, not seeing the students every day would require using class time reviewing on those days where the students have had an extra day to forget, engaging high school students bell to bell is easier to accomplish with shorter class times, modular hasn't worked in the past, etc.
At a faculty/staff meeting of Rincon on 8/10/2010, many many such arguments (and others) were made to the tune of "modular is good for most teachers, but does a major disservice to the students." This discussion dominated the meeting. Why? At some point in the summer, UHS decided they were going to try a modular schedule, but without having a discussion with Rincon (in fact, modular had been brought up in the previous spring, but the issue was grieved and widely considered dead). This came as a great shock (a sock in the gut actually) to Rincon, especially since classes were right around the corner and those who had been at the school for a decade or more had seen the benefits of a sequential schedule for their school. We had a vote at the meeting and the results were quite clear: over 60 votes OPPOSED to modular and only one vote in support. OK, so the schools need to come together and decide what to do as a whole, right? Well, UHS had already sent out schedules to students reflecting their modular proposal, and likewise Rincon had sent out their sequential schedules. This was a divisive issue... teachers were angry, parents were confused.
Meetings to resolve this issue were delayed but finally a Rincon Site Council meeting on 8/19/2010 seemed to promise a decision. The Site Council opened with roughly 15 statements from the audience all re-stating their strong opposition not only to the modular schedule but also the way they felt disrespected by the process. Next, a vote was taken here as well, and again the results were clear: no one was in favor of the modular schedule, and all who voted (there were four present but not voting) were in favor of keeping sequential. We then convened to principal Abel Ramirez's office for a phone conversation with Dr. Edith Macklin-Isquierdo (Assistant Superintendent of High Schools) to discuss this bell schedule issue. Dr. Macklin voiced some support of trying a modular schedule but also stated that it was ultimately our decision (as a campus). I left that day confident that we'd be keeping the old schedule and that our voices had been heard and appreciated.
The next day was school spirit day at Rincon. All employees and many students were wearing purple with pride. Toward the beginning of second period an announcement was made stating that next week we would be switching to a modular schedule. This was a Friday by the way. There was a small meeting where this was decided, and it was, in fact, recorded. I hope to give a link to that audio soon. I think the Rincon and UHS students, parents, teachers, and staff, all deserve to know what transpired in that meeting.
Since classes had not yet begun at the University of Arizona, I went to school all day every day the first week. In all of the classes (except calculus) on the first day we went over our expectations and goals followed by our first ice breaker which we adapted from a suggestion of Antwi Akom given at the aforementioned conference on transformative education. This ice breaker consists of having students split up into pairs and interview each other. When one student is answering a question, the other student is listening carefully and taking notes. When the interviews are over, we go around the room and have each person tell the story of their partner. Some of the questions we asked were "What have you done to help your community or the environment?", "Have you ever been discriminated against or marginalized? If so, how was the issue resolved?", "What do you think it means to be good at math?", and "How do you think teachers could improve how they teach math?". Early in the morning, Charles and I interviewed each other with two of the above questions as well as a question related to our background so that they could get to know how we got to be where we are. The activity served its purpose but we ran over in a couple of classes and had to finish the next day, so time management is key in this activity.
On the second day, we wanted an activity which warmed them up to critical thinking and team building. Charles suggested the following: have the students work in groups of four (at their island) to come up with four different ways of turning the numbers 2, 4, 5, 8 into 24 using each number exactly once and some combination of the operations addition, subtraction, multiplication, or division. For example, (2·4)(8 - 5) = 24 or (8/2) + 4·5 = 24. We did the same thing with the numbers 3, 7, 9, 10, which is a little more challenging. We had students coming up to the board, writing their answers, and explaining what they wrote, a good communication exercise. We also finished up the activity from the prior day and went over some classroom policies.
For the rest of the week in the precalc classes, we began work on a "review" packet to dust out the cobwebs and also to assess basic skills. We preached one of Charles' favorite mottos: each one, teach one. Sometimes students can explain a solution better than the teacher because the students share similar perspectives and (mis)understandings. We had good coverage in helping students solve problems. We expected students to share what they had learned from us with the rest of their group, but that did not always work; we noticed some of the same questions being asked within a table. I think it served as a good refresher, but the problems consisted entirely of symbolic (rather than conceptual) skills which led a little bit to the old "this is arbitrary" attitude. We tried to emphasize, however, that this packet was reflective of their previous courses... they've been learning a language, and in precalc we'd be using that language to analyze, interpret, and apply various functions: linear, quadratic, polynomial, rational, exponential, logarithmic, logistic, and trigonometric.
There was a nice problem in the packet which gave me the opportunity to introduce modular arithmetic. Students were asked to compute i53 where i = √ -1 is the imaginary unit. When students asked me about this problem, I first had them tell me that i0 = 1. Then I had them say that i1 = i. Next, they saw that i2 = -1 by definition: i is a number whose square is -1, so it's not on the real number line which is why we give it the name i for imaginary. Then I asked them what i3 was. After some encouragement they noticed that i3 = i2i = -i and finally that i4 = i2i2 = (-1)(-1) = 1. Now they noticed the pattern... 1, i, -1, -i, 1, i, -1, ... There's only four possible answers, and to find the appropriate one, we just need to find the remainder when we divide 53 by 4. I justified this by asking them the following questions: "If it's 11 o'clock now ignoring am or pm, what time will it be four hours from now? What about 26 hours from now?" Well, they noticed that the trick was to treat 12 as zero. We call this "reduction modulo 12" and we write 11 + 4 = 12 + 3 ≡ 3 (mod 12) and 11 + 26 = 3·12 + 1 ≡ 1 (mod 12) in the context of the above questions where, in general, a ≡ b (mod n) whenever a - b is a multiple of n. For powers of i, we're dealing with a four hour clock, so we need to take out as many multiples of 4 as we can, and the remainder will tell us the time. In this way, we have 53 = 4·13 + 1 ≡ 1 (mod 4), so i53 = i1 = i.
In calculus, we skipped the ice breakers and immediately jumped into a review packet which was basically the caliber of a college algebra final exam. We really want to push the calc class hard and do very well on the AP exam. We'll begin prepping for the test immediately after we finish any material which could be covered. We want to set up a one day per week after-school session specifically geared toward working through old AP exams and tackling AP-like problems. The students are receptive to this idea.
In stats, we showed a clip I cut from "Unnatural Causes," a documentary studying the correlation between health and wealth. We gave students only a few vocab words like population, sample, parameter, and statistic, and asked them to identify these in the context of the video. It was part a general theme we'll do in the class: students will read or watch something making a claim which uses statistics, and then they will answer a series of questions (in paragraph form) about the clip or article using vocabulary they've learned. The idea is an extension of something Charles had already done in precalc called "Where's the math?" We want to deconstruct the idea that stats is just computing some invariants from a list of data. Stats is also about persuasive arguments and interpreting what those invariants are actually telling you about the population.
In the second week of classes, I started my Tuesday/Thursday schedule. We began to study linear functions in precalc via a lab in which students plotted some points on a Fahrenheit-Celsius coordinate plane. They noticed that the two temperature scales exhibited a linear relationship. They were asked a number of questions about this relationship which included coming up with a formula to convert Fahrenheit to Celsius, determining whether the two were proportional to each other, and knowing the difference between a function given by an expression and a function given by a table of values. Honestly, I love this lab, but there was definitely a strong resistance from the students to reading the lab (even though it was only around four pages). Again, they still don't see math as science, but we'll continue to emphasize that the tools they've been learning can be used to analyze and solve real-world problems. We gave them a reprieve on the the first deadline since we really wanted them to understand that the lab report was like any other essay or summary they'd turn in for another class: we wanted a typed analysis of what they did and learned in the lab. There is no length requirement, and we insist, in fact, on students communicating the activity in their own words. We are attempting to reinforce the same writing techniques they need to master in other courses as well.
In calc, we began course material. Specifically, I gave a short lecture on parametric equations where I shared my viewpoint that whenever we have a curve in the plane (regardless of whether or not it passes the vertical line test) we can imagine a particle tracing out the curve over a period of time. We can hence describe the coordinates of the position of the particle at any time t as a pair of functions (f(t), g(t)). We noted that different parameterizations could trace out the same curve, it's just a matter of how the speed/direction with which the particle will travel varies over the period of time. Our first motivating concrete example was the familiar parameterization (cos(t), sin(t)) of the circle justified by trigonometry. I then showed them how we could exploit this to find parameterizations of the spiral and lemniscate (pictured below) by noting how the radius varies with respect to the angle.
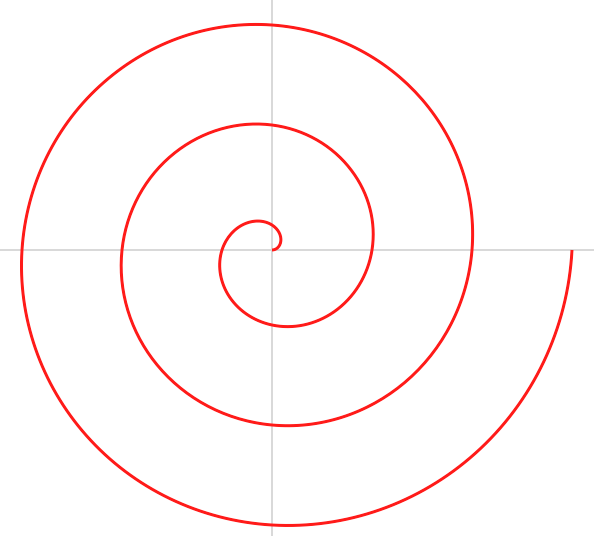 | 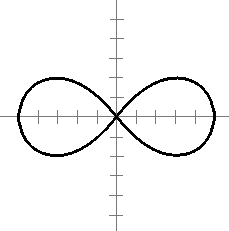 |
| (tcos(t), tsin(t)) | (sin3(t), sin2(t)cos(t)) |
In stats, we continued building vocabulary and gave them a series of local newspaper articles to analyze. As with the precalc lab, we really wanted to focus on good write ups: typed summaries and critical thinking using terminology we've introduced. We also began our journey into descriptive statistics while trying to keep the interpretive side in view as well. After all, the way samples are collected and displayed has a ton to do with the validity of the claims being made. We used data from Rincon itself on Friday. I put a collection of frequency tables on the board which showed the grade distribution in mathematics (rows: A, B, C, D, F) among various ethnicities (columns). We discussed how making separate pie charts for each column allowed us to make comparisons while comparing histograms could be deceiving since the sizes of populations were different. Hopefully, we can return to this on Tuesday and try our hand at interpreting what the data is telling us.
In precalc, students turned in their Fahrenheit labs with wide variation in quality. Some papers were so excellent that we used them as examples in other sections to show students what we wanted to see. Some reports were so poor that we simply handed back the paper and told the student to completely re-format. I hope this will set the tone for the year, but I worry that students may start to consider dropping or just giving up. We like to stress that these labs are the most important component of the class and that everyone should get all the points possible on them because it's something they have outside time to work on and additional redemption time if it's not up to par upon first submission.
Next, we moved on to simplifying difference quotients: that is, expressions of the form
f(x + h) - f(x)
h
At first, we just told the students we were interested in the finding slopes of curves (not just lines) and that one idea was to find the slope of the line between two points on a curve. This would give you the average rate of change over the interval spanned by the x-coordinates of the points. If one of the points was (x, f(x)) and the displacement on the x-axis was h, then the above difference quotient was the desired slope. We hinted that they should think of the displacement h as being very small since what we really wanted was the instantaneous rate of change at any point along the curve. Indeed, since Charles loves to focus on the "calc" and not so much on the "pre" we eventually had them set h = 0 after simplifying. In fact, they used the language, notation, and concept of the derivative. The question "Why don't we just put h = 0 to begin with?" arose, and we reflected it right back with "OK, what happens if you try to plug in h = 0 straight into the difference quotient?". A few moments later, they realized that you get 0/0, which tells you no information. This justified why we did so much work trying to "cancel the h's". Another natural question came up: "Why do we care about the (instantaneous) rate of change anyway?" I gave a couple of examples: (1) If we had a (differentiable) profit function P(x) and we wanted to know precisely when profits were maximized (or minimized for that matter), we could compute the derivative P'(x) (rate of change) and see where this is zero (I drew a graph showing the horizontal tangent lines at local maxima and minima). (2) I argued that the derivative gives you a deeper analysis of what's happening with a function. Specifically, we can look at a function modeling the number of unemployed and notice if it's increasing or decreasing, but we get more information if we knew the rate at which the numbers were rising or falling. In other words, the number of unemployed might be going up, but if the rate is decreasing, then it's a sign that the economy is stabilizing.
We also started work on quadratic functions. In particular, we began a worksheet where a quadratic equation models the position of some cargo dropped from a helicopter: the usual assumptions about constant acceleration and no wind resistance apply. I saw this as a chance to offer an extra credit project on linear functions (since we'd just finished that section). The students seemed very receptive to the idea which is as follows: The boys' bathrooms at Rincon are lacking a certain something... most notably soap, a window, and paper towels. In fact, one of the bathrooms (the one closest to our classroom) has been closed off for weeks. See the image below.
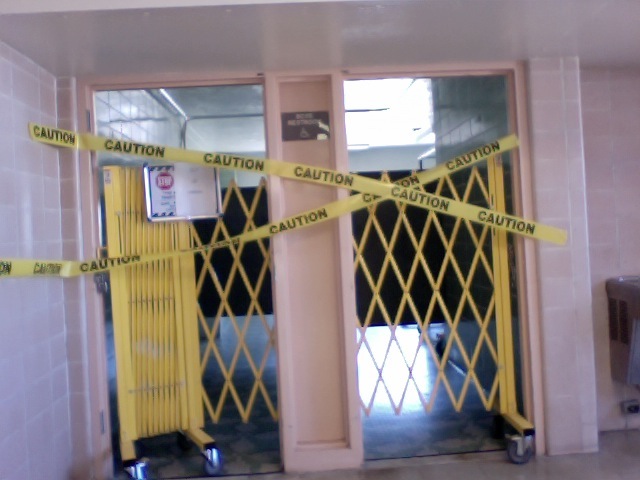
When it was open, three of four urinals were clogged, and, like the other bathroom, there was no soap nor anything to dry your hands with assuming you could have washed your hands in the first place. See the image below.

This bothered me a great deal and I wondered how to get the students involved. After all, how can we expect them to give their best effort when their basic right to a clean restroom had apparently been given such a low priority? Recently, we were visited by Abel Ramirez during our planning period and he shared with us some very good news: Rincon will be completely overhauling the bathrooms and will be putting in hand dryers to boot. I was thrilled to hear this. Again, we still wanted the students involved in the process, so I put together this project which outlines how we can lobby for a really nice hand dryer (namely, a Dyson air blade). The best project among all our sections will be presented to Mr. Ramirez, and maybe we can convince Rincon to go with high end, eco-friendly hand dryers which actually work (as opposed to most hand dryers).
In calculus, we began our study of limits. I was asked to give an improvised lecture on the Squeeze theorem, which I did but the students got to see me struggle a little bit at the board when going through the classical example of showing that sin(x)/x approaches 1 as x approaches 0. I think it was a positive experience for them to see that mathematics is not always laid out so nice and neat, and that to solve a serious problem requires brainstorming, trial and error, and (most importantly) patience. I wrote up a worksheet which went back over the example, but this time more carefully. I think they'll appreciate it more now having seen the difficulties of trying to establish a lower bound. We've also begun our once weekly calc tutoring, and I'm extremely pleased that almost every student has been attending. When we finish with limits we'll being working through AP exam problems which deal with the topics we've covered. At that point, it will be absolutely imperative that every student be in attendance.
In stats, we continued talking about the frequency tables which displayed the number of a given ethnicity who earned a given grade in math at Rincon last year. We used this data in multiple ways. Aside from just displaying the data, we first discussed measures of center: mean, median, and mode. We focused on which measure of center is appropriate based on the shape of the distribution involved. For roughly normal (symmetric and bell-shaped) distributions, the mean works very well and tells us what a "typical" data value should be. However, when the data is skewed, the mean (as the balance point) is not a good measure of center, and we should look to the mode in the case of discrete data. We also discussed multi-modal data, which we saw in the Asian American column: there was a bimodal shape with the largest columns at A and F. Earlier we had also mentioned how the median was a more appropriate measure of center when there were outliers involved.
Next, we began our discussion of measures of variation. I went through a common motivation for the standard deviation: a deviation for a data value x is how far away x is from the mean μ, namely x - μ. If we want to know how spread out a data set is, then we want to know what a typical deviation is. However, taking the average deviation gives us zero, so we have to do something different. If we look at the squared deviations, then the average of these gives us a good idea of what a typical squared deviation is, so we can take the square root of that to get back to what a typical deviation is. That square root is the standard deviation σ. I put up some more real data to investigate σ. This time I went to this website to find AIMS scores (standardized test scores) for Rincon and other high schools in TUSD (but just those who regularly have over 100 students taking the exam). I found the percent meeting the standards for the past three years in mathematics for ten schools including Rincon, UHS, Tucson High, Sabino, and Palo Verde. It was clear that the precent meeting the standards for Rincon (and indeed for most schools) had dropped significantly in the past year (perhaps due to a new exam), but the general trend was that the data had become more spread out (since the standard deviation σ had grown). Students computed how many standard deviations away from the mean that Rincon was and how that had changed over time. Since most schools dropped in performance, it wasn't clear what this meant for Rincon specifically. By finding the number of standard deviations from the mean, we were able to get a better grip on what was happening to Rincon with respect to the other schools. This will be an ongoing theme, no question.
In precalc, we pressed on with the "Instant of Impact" packet. A cliff diver needs to determine what speed he'll hit the water at to see if he would be violating his doctor's orders. We're given a height function h(t) which tells us how many feet above the water the diver is t seconds after jumping. I've included a screen shot of the assignment page below. We joked that picture suggests the diver would hit the rocks before making it to the water.

The students had to first find out when he would hit the water in first place, so they had to find the time t for which h(t) = 0, which amounted to solving a quadratic (that unfortunately was cooked up nicely to have integer roots, a situation which would almost never happen in nature). It seems like a simple idea... he hits the water when his height above the water is zero. However, getting this out of the students is not so easy, especially since some of the students know this backwards and forwards while others are used to plugging things in at random and hoping for the best without actually stopping to think about the physical interpretation. That said, it was a useful block day we spent going over the packet very carefully. We payed particular attention to having the students tell us what each question was asking for first before we tried to do any calculations or manipulation. Are they asking for time, height, average speed (distance over time), or instantaneous speed (need to compute the derivative and evaluate)? At every step, students gave their answers and explanations. We also emphasized the skill of telling what a reasonable answer is. For example, we found the that average speed of the diver over smaller and smaller intervals before impact was increasing, so the instantaneous speed at impact should be larger than all of these average speeds. As another example, we wanted to see how long it took a runner to finish her leg of a relay. Again, this amounted to solving a quadratic, but we got two solutions, so since we're finding time, the negative answer was extraneous. We also dealt with the issue of velocity versus speed; when we looked at the cargo being dropped from a helicopter or the diver jumping off the cliff, we found that the derivative was negative for positive values of time. First, we explained that velocity tells you direction as well as speed, so the negative sign indicates that the object is falling rather than rising. We also saw the chance to mention that the derivative is negative when the original function is decreasing; we demonstrated this by sketching the graph and following the curve showing how the tangent line was getting steeper, but always had non-positive slope.
We also handed out the next precalc lab which centers around the Galileo experiments with falling objects. This time, however, the students weren't given a height function, just a table of values from which they had to derive a distance function by noticing that when they plotted the points, the shape looked parabolic. There was lots of moaning when we handed out the labs, the major complaint being the length of the lab (only a few pages), and the apparent refusal to read. I really hate to say this because there are a good number of students who do, in fact, read the lab over carefully first, making notes along the way. The majority, however, are still applying their impatient problem solving to the assignment. For instance, the lab will ask them some questions as they go along and instead of thinking about what's being asked, the students are more interested in asking "Is this something we need to turn in?" or "Is this part of the lab write-up?". If it isn't something they will directly include in the report, they tend to skip these components without realizing that the the official lab report questions are just the accumulation of the baby step questions they passed over. I do sympathize, however: on the one hand, I like terse writing where the questions are compelling (and to the point) and you have to fill in the details yourself, but on the other hand, there's something to be said for having the ability to filter/parse through a lot of information and to follow through with a longer guided activity. Another complaint with the labs seems to be that students feel like labs don't belong in math. Of course, we're doing physics in these labs to emphasize the math concepts, but they may be on to something when they point out that they aren't physically investigating anything (the data is just given to them in a table). Perhaps we can give them some more hands on labs for which they have to perform experiments, gather data, and then synthesize conclusions. That would more closely resemble what they are used to in other lab settings. Nonetheless, since we set the bar very high from the get go they know that they're accountable for the work, so even though it's painful, they do take advantage of working in class and helping each other in their teams.
We received some pretty nice looking extra credit projects (the Dyson idea), and we'd like to put several of the best project writers together so that they can come up with a super slick proposal as the sum of their collective efforts. We're holding our horses a little bit however, because we may be able to add some incentives from Dyson to the proposal. Let me explain. My father HC read the last blog entry about the project and I apparently inspired the pants off of him. He wanted to get involved, so he contacted Dyson and told them what we were working on to see if they could offer up any kind of discounts or even just a certificate to recognize the winners of the project competition. He was able to get a hold of some people at Dyson who expressed an interest in at least listening to what we had to say. I sent a link to the blog and project to a representative who said they would read, think, and get back to me. I'm hopeful that Dyson will see this as an opportunity to help out a school in need and to build upon a positive public image of the company. It can't hurt to ask, so we did.
As always, calculus is a joy to teach. The students are self-motivated and hard working. We wrapped up the chapter on limits and we've begun derivatives. Many of our students had Charles for precalc, so they are already familiar with many of the basic rules of differentiation (or at least know when to apply them/look them up when they need to). I shared with the students recently my formal intuition for the chain rule:
(f(g(x)))′ = f′(g(x))g′(x)
One way to remember/formally justify this rule is to make a change of variables by letting the inside junk (i.e., g(x)) be a new variable y. In this way, we want to find
df(y)
dx
but we know (presumably) the derivative of f(y) with respect to y, so multiply and divide by dy (this is the fudging) to get
df dy
dy dx
This formal calculation helps us see why the derivative of g pops out... the change in f(y) over the change in x can be computed in terms of the intermediate variable y since we have a change in y on the top and bottom which "cancel" each other.
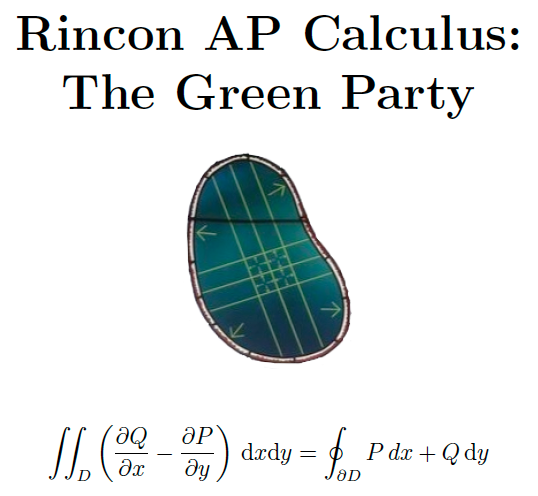
Charles had the nice idea to get T-shirts made for our AP calculus class. Then we could have a designated day on which we all wear our shirts. I'm in the process of coming up with a few possible designs upon which the students will vote for their favorite. Of course, I've encouraged them to come up with designs too, and we'll throw those into the mix as well. Here's a tentative version of one design in which the statement of Green's theorem is shown along with a diagram found on a stained glass window honoring the mathematician George Green in the dining hall of Caius College in Cambridge (yes, I realize there's a d which should not be italicized):
In stats, we followed up the AIMS math scores. I typed up the data we were using in this table which shows the percent of sophomores passing the math component of the AIMS test for the past three years. We noticed that the scores really spread out (i.e., the data set had a larger standard deviation) for the most recent year due in no small part to the fact that a new exam was used. We wanted to compare different years to one another, but we had to account for the difference in variation. This was a nice way to introduce the notion of a z-score which is a deviation divided by the standard deviation
x - μ
σ
This allowed us to determine that Rincon's z-scores were indeed tanking, so the major drop in scores for Rincon was not simply the result of a new exam. We also computed what percent passing we would have needed to maintain our prior z-scores.
We also tried to wrap up our basic concepts unit by doing a couple of what I refer to as Big Lebowski rugs: they "really tie the room together". First, we worked on on an in-book project which gave multiple frequency tables from which we compare means, standard deviations, shapes of histograms, and so forth. It also gave us an opportunity to go over how to compute various stat summaries from data sets or frequency tables using their TI-eighty-whatever. Now they can display box plots and histograms quickly to more easily and accurately visualize numerical data. Of course we wanted them to do these things by hand at first, so we waited to show them the calculator short-cuts.
Next, we spent a day discussing confounding variables, that is, outside factors which could affect a study other than those explicitly mentioned in the claim. We started by discussing Jared Fogle... He lost a ton of weight eating SUBWAY sandwiches, and the commercials claim (or at least imply) that eating their subs help you lose weight. We broke down this claim and mentioned a plethora of confounding variables like, for instance: it was just one person involved in the study, he was a man, he exercised regularly, he didn't get a footlong meatball sub every meal, and on and on and on. Then we listened to a this article which I had heard on NPR's "Marketplace" the day before which talked about predatory lending in Memphis. We had them take careful notes and replayed some key segments multiple times. They worked together to identify various claims that the piece made. For each claim, we found what data was presented in support of that claim and determined the population, sample, and any confounding variables involved. It was a nice change of pace from the purely descriptive stuff we had been going through. They got a peak ahead at the inferential side of things. We emphasized how the population and confounding variables could be different for different claims. We also tried to get across the idea that the same data can be used to support opposing viewpoints and that a well-defined claim can strengthen an argument while a vague argument can have the opposite effect.
The precalculus students turned in their Galileo labs and some of them are quite good. The writing skills certainly are improving even on the second lab. Continuing with the quadratic theme, we showed them how to perform quadratic regression on their TI-eighty-whatevers. Charles has some SmartBoard compatible TI-software which allows us to display a giant calculator on the screen and press the buttons by just tapping the image of the button on the board. The software also keeps track of the keys you press in a key log so that students can see the exact sequence buttons you used if they fall behind. We entered in raw data to the Stat lists, then made a scatter plot, ran quadratic regression, and finally superimposed the graph of the regression equation on top of the scatter plot. We gave the students a worksheet which required these calculator skills, and I felt like this was a nice complement to the Galileo lab because now we couldn't just guess a quadratic function which perfectly fit the data (as is most often the case when you take measurements in nature), so we had to find a curve of "best fit" with the level of approximation measured by how close the R2 (with Diagnostics on) was to one. We really saw the power of having an equation since we could find instant rates of change with the regression equation but only average rates of change with the data points in a table. The regression equation "fills in" the gaps of the table while closely approximating the given points.
We also started our investigation of rational functions; that is, functions of the form
f(x)
g(x)
where f and g ≠ 0 are polynomials. The consensus seems to be that rational functions are easy because there's a rigid procedure for dealing with them: the vertical asymptotes correspond to the zeros of g which are not zeros of f, while the horizontal asymptote (if there is one) can be found by just looking at the leading terms of f and g to see if one dominates the other or if they have the same order and "cancel" to leave y = quotient of the leading coefficients as the horizontal asymptote. Thus the mechanics of rational functions are going well, but there's problems when we get into the subtleties of distinguishing between a vertical asymptote and a removable discontinuity (i.e., a zero of g which is also a zero of f). It's a serious distinction: a vertical asymptote gives us a spike in the graph (because we're trying to divide something nonzero by zero) while a removable discontinuity gives us a "hole" in the graph. Things get more dicey when we have repeated common zeros; if the order of the zero in g is bigger, there's a vertical asymptote, but if the order of the zero in f is bigger, there's a hole at an x-intercept. The word problems with rational functions also seem to be giving students some trouble. When they are asked to interpret what the vertical and horizontal asymptotes mean in context, they tend to stumble a bit. For example, the cost of supplying p% of a town with recycling bins had a vertical asymptote at p = 100, but some had a tough time connecting this with the interpretation that supplying everyone with a recycling bin was impossible (with that model) because the cost would be infinite. The same problems with interpretation came up with horizontal asymptotes as well. For instance, the amount of food eaten by moths was given a rational function of the amount supplied. One part of the exercise asked the students to find when the moths were satiated (full), and since the fixed number of moths can only eat so much, the horizontal asymptote marks the upper limit of consumption. Graphing rational functions is something that needs to be sharpened as well because finding the right window requires knowledge of where the asymptotes are as well as a feel for the scales involved. Sometime soon, however, some of these issues should be ironed out because they'll be getting a rational functions lab where they must graph and interpret. We're giving them two choices: one lab in which they'll be modeling cost/profit functions from selling doormats, and one lab that I'm writing about black holes (which we'll be more terse, but will be quite conceptually challenging).
I still have not heard back from the Dyson people after they said they would be in touch within a couple of days of reading the blog/assignment. I emailed my contact again, but I have not gotten another response yet. I was hoping to hold off on presenting the projects until we had word from Dyson, but I suppose we need to move forward without them. Perhaps if we can convince the school to go with the Airblades, then Dyson can step in and offer a deal or discount.
In calc, we're wrapping up derivatives of trig/log functions and implicit differentiation, so now they can find the derivative of
y = xx,
a function which I showed them earlier this year and challenged them to find dy/dx for. Last Thursday, I handed out this practice test which consists of AP exam-like problems they should be able to do now. I like the questions, but we had so many other students in our room after school for tutoring in precalc and stats that we didn't have the chance to go over the problems together. We need to make absolutely certain that we all know how to complete every single one of these problems perfectly. Maybe we can have a "calc only" session, but it seems wrong to deny anyone help if we're around. On the other hand, I refuse to let our students do poorly on the AP. We need to find a balance (or an extra day in the week). I showed the students a couple more possible T-shirt designs. I've included an image below of what seems to be the most popular design thus far.
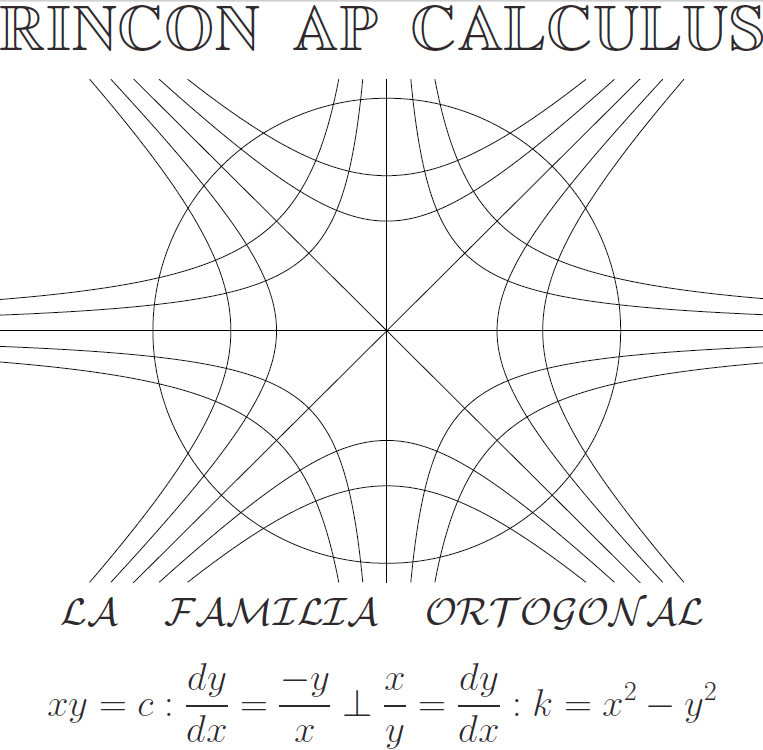
The equations represent orthogonal families of hyperbolas which means any curve from one family will intersect any curve in the other at a right angle where the tangent lines are well-defined (so the derivatives are negative reciprocals of one another). We would likely have the design in white on a purple shirt (with black borders around the letters).
In stats, we entered the chapter on probability. Up to this point, the "math" content has been (according to many of the students) easy, but now the notation of probabilities P(E) of events E as subsets of the sample space S consisting of all possible outcomes O, is weighing a little heavy. The two major focus points have been on mutual exclusivity and independence of two events A and B: the events are mutually exclusive if there intersection is empty, i.e.
P(A and B) = 0
so they can't both occur simultaneously, in which case
P(A or B) = P(A) + P(B)
since there's no doubling counting, while the events are independent if the probability of one is unaffected by the condition of the other, i.e.
P(A|B) = P(A) and P(B|A) = P(B)
where the "|" should be read as "given," in which case
P(A and B) = P(A)P(B).
We extended the notion of independence to variables in the context of contingency tables: we have a two way frequency table with the rows representing values of one variable and the columns representing values of the other variable. If the variables we independent, then we could use the multiplication rule for independent events above to compute the entries in the table by only knowing the row and column totals. We call these entries the expected frequencies, because these would be the entries we'd expect if the variables were independent. We began with an example from Triola's "Elementary Statistics" in which I gave them the following table of adult Titanic passengers broken down into male/female and survived/died.
| Male | Female | Total | |
|---|---|---|---|
| Survived | 332 (520) | 318 (130) | 650 |
| Died | 1360 (1172) | 104 (292) | 1464 |
| Total | 1692 | 422 | 2114 |
where the expected frequencies are in parentheses and the observed frequencies (what actually happened) are not. At first, I gave them only the row and column totals and they calculated the expected frequencies using the product rule for independent events. Then I wrote down the observed frequencies. Obviously, if gender was independent of survival, then a lot more men died than should have (in support of the "women and children first" theory). Of course, we want to quantify how different the observed frequencies are from the expected. More precisely, what's chances that gender and survival were really independent and we just observed a statistical oddity? This is what we call the p-value. It's a very powerful way of describing just how dependent two variables are on one another. Small p-values (say, less than 0.05) mean that we're at least 95% confident that the variables are not independent (that is, they are related in some way). We computed the p-value for the above table using the χ2-independence test on our TI-calculators. The p-value was so small that the calculator considered it 0. This means that there's (virtually) no chance that gender was independent of survival on the Titanic. I wrote this project for the students as the last gasp of the first quarter. I hope they are creative and thoughtful with it. I tried to emphasize that independence does not imply cause and effect, and that we must consider all possible confounding variables.
In precalc, we're wrapping up our section on rational functions with two labs. In one of the labs, the students investigate average cost functions F, G, H for selling some number x of doormats. The first function comes from a linear cost model: it costs $5 to make each doormat and there's an annual fee of $200, so it costs f(x) = 5x + 200 to produce x doormats in a year. Thus the average cost is
F(x) = f(x)/x = (5x + 200)/x = 5 + 200/x
which is a rational function with horizontal asymptote y = 5, meaning that the average cost goes down as you produce more and more doormats but never actually reaches $5. What if we had a quadratic term in our cost function which described some form of discount? Then our modified cost might look something like g(x) = -0.0003x2 + 5x + 200 so our average cost becomes
G(x) = g(x)/x = -0.0003x + 5 + 200/x
which is again a rational function, but now we don't have a horizontal asymptote, rather a slant asymptote. The term 200/x becomes small as x becomes very large, so G(x) asymptotically approaches the line -0.0003x + 5. In this model, however, the average cost eventually becomes zero (and the negative), so it's not incredibly realistic. We can get a more feasible cost function by throwing in a cubic term to arrive at another cost function h(x) = 0.0000001x3 - 0.0003x2 + 5x + 200 and another average cost
H(x) = h(x)/x = 0.0000001x2 - 0.0003x + 5 + 200/x
which has a parabolic asymptote. This H(x) can be minimized at around x = 1806.4432. Clearly, we would want our average cost to be minimal, so this minimum of H(x) shows us how many doormats to produce per year.
In the other project, which we'll start this week, students will explore the death of a star which has burned up its thermonuclear fuel, but cannot support its own mass and collapses inexorably in on itself to form a black hole. I've embedded a screen shot for the pdf of the project below.
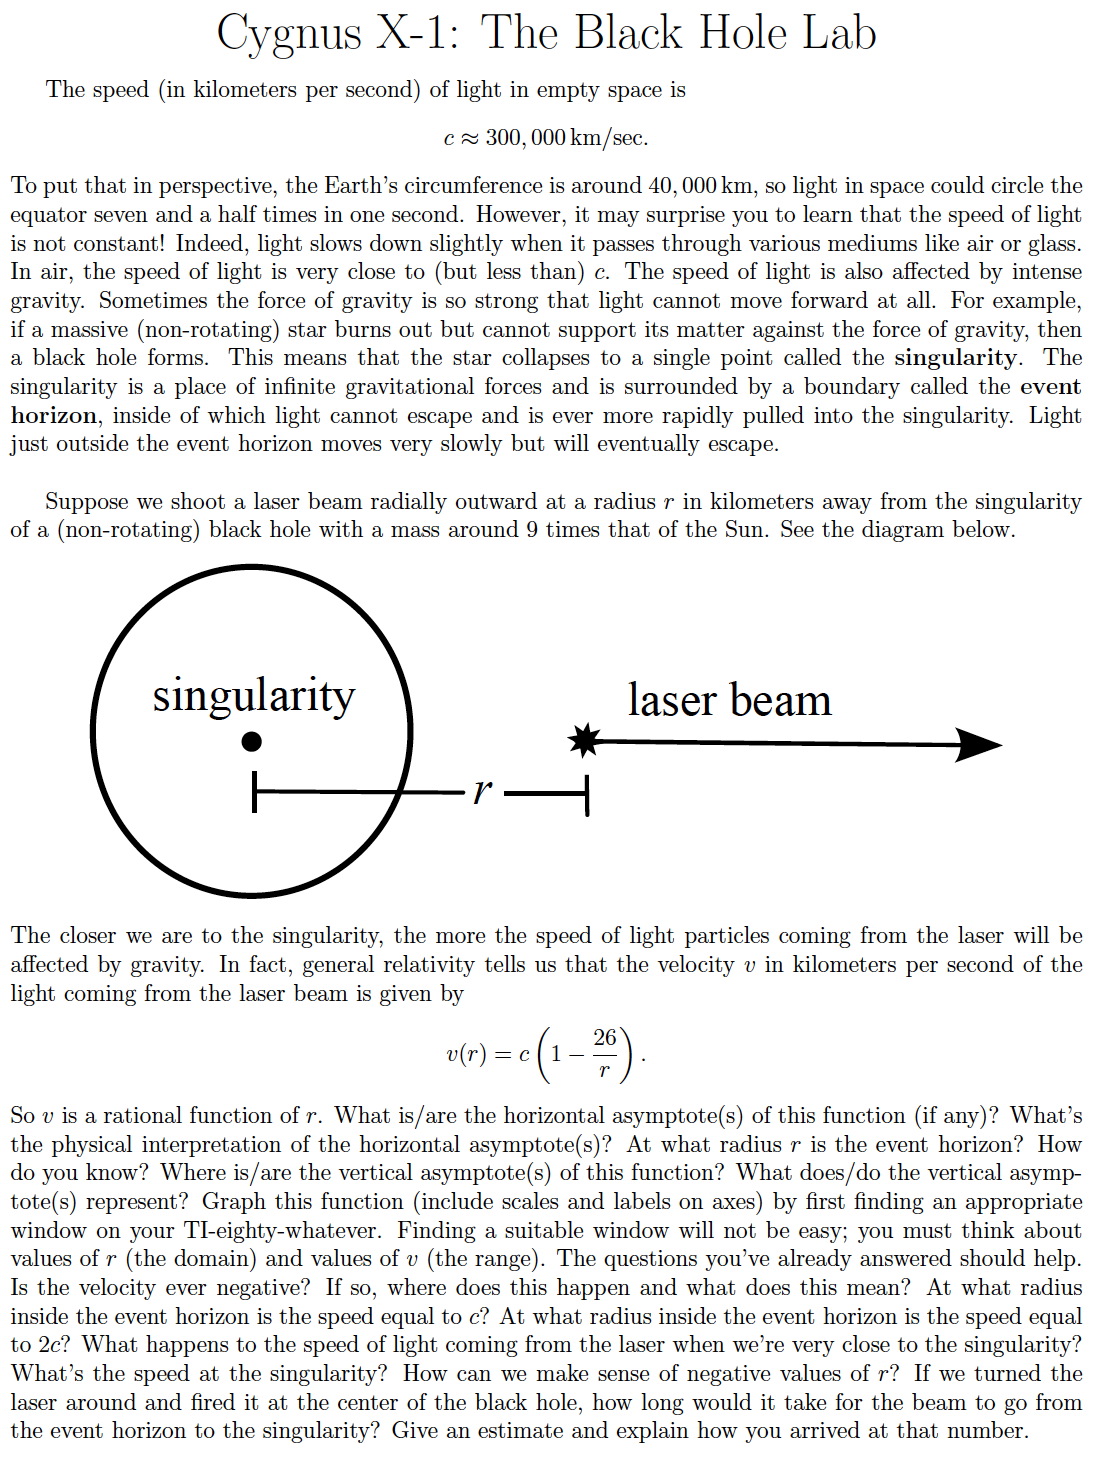
It's an ambitious project inasmuch as there's lots of questions at the end which require some Deep Thoughts by Jack Handey. On the other hand, I'm counting on it being intriguing and original enough to hold the students' interest, so perhaps they'll receive the challenges as adventures.
We also started discussing exponential functions, that is, functions of the form y = bx where b > 0 is a fixed base while the exponent x varies. I tried to motive the discussion with compound interest. Inspired by my fellow G-TEAMS fellow David Love, I used this clip from the TV series "Futurama" to drive home the importance of computing interest on interest. In the clip, Fry notices that his old bank still exists. When he check his account, he discovers that it's grown to $4.3 billion in the 1,000 years that he's been frozen even though he only started with 93 cents at 2 and one quarter annual interest. OK, let's say we start with some initial amount P (the principal) and put it in a savings account with an annual rate r. The amount A after t years depends on how the interest is computed. If only compute interest on the principal, then
A = P(1+rt)
which is what we call simple interest. This grows linearly (aka slowly). If Fry's account used simple interest, he only would have accumulated $21.86 after 1,000 years! On the other hand, if we're keeping the money in the bank, then we're earning interest, so we should be able to earn interest on that interest. If we compound interest annually, then
A = P(1+r)t
which grows exponentially (aka fast). In Fry's case, we get A = $4283508449.71 even though he only would have had around $80 after 200 years. Further, we noted that more compounding periods per year means more interest gained. Moreover, there's a limit to how much interest can be gained. Precisely, if we have infinitely many compounding periods in a year, then A = Pert where e is an irrational number between 2 and 3 (see the calculus discussion below). We call this continuous compounding, and if Fry's account used this continuous interest, his 93 cents would have grown to roughly 5.5 billion dollars in 1,000 years.
In calculus, we discussed the real reason we care about the number
e = 2.718281828459045235...
and why we call it the "natural base". It's because the function y = ex has the property that its derivative is equal to itself. Likewise, the natural log function y = ln(x) has a nice derivative too, namely 1/x. You can interpret this as saying that the area under the hyperbola y = 1/x and above the x-axis between 1 and any real number t ≥ 1 is ln(t). Once we know these derivatives, we can find the derivative of any exponential or log by just changing bases.
Later, I gave the students some "evil" functions to differentiate. I feel that if they can tackle some pretty intimidating derivatives, then the standard stuff is a piece of cake. In particular, I wanted to challenge their grasp of the chain rule along with all the other rules we've learned thus far. Here's the functions I gave them:
y = log3(sin2(ex))
y = √ arctan(xπ^x)
and the Dr. Seuss functiony = 222x
Needless to say, we had some fun and exposed some weaknesses.
In stats, we delved into counting principles. Sounds like child's play, but these tools can be very powerful when computing probabilities. The most fundamental of these is that when there are m ways of choosing one thing (intentionally vague here) and there are n ways of choosing some independent thing, then there are mn ways of choosing pairs of these things. For example, if we're at a movie theater and paying far too much for sodas, there's typically three sizes (medium, large, and ridiculously large) and, say, seven possible fountain drinks, so there's 21 total carbonated options. It's quite important that the things we're choosing are independent (the size has nothing to do with the flavor). We can apply this simple idea to derive other, less obvious principles. Let's say we have 100 songs on our iPod, and we want to play every song exactly once but in a randomly chosen order. How many different playlists can we have? Well, now our "choices" consist of the first song, second song, etcetera. Now, of course, our choices are not quite independent because, for instance, the second song we choose will depend on the first (we can't choose the same song twice). We have 100 choices for the first song, but now that we've picked one, there's only 99 choices for the second song, 98 choices for the third song, and so forth. So the total number of playlists is
100! = 100⋅99⋅98⋅...⋅3⋅2⋅1 ≈ 10158
where the ! should be read as "factorial". This is a HUGE number. How big is HUGE? Well, there are approximately 1082 atoms in the known universe, and our number of playlists is larger than this by a factor of 1076. We'll never hear all the possible orderings. There's just too damn many. We've just counted permutations, that is, arrangements where the order matters. What if we're only interested in all possible top ten favorites? We'd still be counting permutations since the order of the top ten matters, but now we're only choosing 10 slots, so there's 100 choices for the first, 99 choices for the second, and so on until we get to 91 choices for the tenth. Thus there are
100P10 = 100!/(100-10)!
total top ten lists. OK, what if order doesn't matter? Then we're talking about combinations. Here's an example: Let's say a basketball team has 12 players and they need to elect three captains. How many different sets of captains are there? Here we just care about the set, not the sequence, of captains, so we take the number of permutations 12P3 and divide by the number of ways we can permute the three captains (this is how we forget about the order), namely 3!. So the number of sets of captains is
12C3 = (12P3)/3!
In general, the number of subsets of size k coming from a set of size n is
nCk = n!/((n - k)!k!)
read as "n choose k". Some may recognize these numbers as binomial coefficients. Indeed, we have the binomial expansion
(x + y)n = xn + nxn - 1y + ⋅ ⋅ ⋅ + yn = nC0xn - 0y0 + nC1xn - 1y1 + ⋅ ⋅ ⋅ + nCkxn - kyk + ⋅ ⋅ ⋅ + nCnxn - nyn
so the kth coefficient in the binomial expansion is n choose k. These numbers also show up in Pascal's triangle: we add on a new row by putting a 1 at the beginning (to the left of the prior row) and a 1 at the end (to the right of the prior row), and we get the other entries (below and in between entries in the prior row) by adding consecutive entries in the previous row. The first six rows are shown below.

Notice that when we sum up all the entries in a row we get a power of 2. This should not be too surprising when we consider plugging in x = 1 = y to the above expansion: we get
2n = (1 + 1)n = nC0 + nC1 + ⋅ ⋅ ⋅ + nCk + ⋅ ⋅ ⋅ + nCn
In any case, there are all sorts of neat combinatorial facts related to Pascal's triangle including a formula for the Fibonacci numbers, the Catalan numbers, and (big shock) the triangular numbers. So what's this have to do with counting? Well we've added up all the (mutually exclusive) combinations, so the total number of subsets (of any size) in a set of size n is 2n.
|
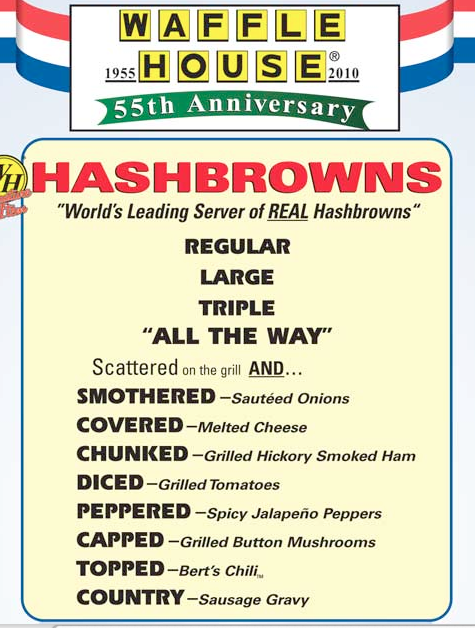
The above observation becomes useful
when answering one of my
personal favorite combinatorial
questions: "How many different
ways can I order my hash browns
at Waffle House?" According to
the menu on the left, there
are three different sizes (regular, large, or triple),
two different preparations (scattered or plain), and
eight different ingredients to choose from.
Hence we get
3 ⋅ 2 ⋅ 28 = 1,536 different options where the 28 comes from the fact that in our order we're selecting a subset (of any size) from a set of eight possibilities. Alternatively, we can think of an order form where we check "yes" or "no" for each of the eight add-ons, so that there are two choices (yes or no) for each ingredient. This is all well and good, but I remember seeing a poster in Waffle House claiming that there were over 2.3 million ways to order hash browns. Huh? Turns out that there are some hidden variations. There are actually four different preparations (scattered, plain, dry, and steamed), three cook times (light, regular, and well), still three sizes, and sixteen ingredients (including Thousand Island dressing and blue cheese... gross!). These new parameters give4 ⋅ 3 ⋅ 3 ⋅ 216 = 2,359,296 which does support their claim. Of course, we should also ask ourselves if anyone would actually order salad dressing on their dry, well done, triple decker tators. Nonetheless, they have themselves a fine establishment and I love the cheese and mushroom omelet (or maybe it's an omelette) with a waffle on the side. |
We've moved on to logarithms in precalc; these functions logb(x) are inverses of the exponential functions bx, meaning
logb(bx) = x
and
blogb(x) = x
so the log "undoes" the exponential and vice versa. As such, we inherit properties of logs from properties of exponentials. For example, knowing that exponentials take sums to products, i.e.,
bx + y = bxby
implies that logs take products to sums, i.e.,
logb(xy) = logb(x) + logb(y)
OK, why do we really care about logs? Well, x = log2(7) is the solution to the equation 2x = 7. Yeah, so? There are lots of applications of exponential functions in modeling real world phenomena. For example, exponentials come up in population growth with no carrying capacity, compound interest (as we saw in the last entry), and radioactive decay. To answer certain questions of interest, we need to be able to solve equations with logarithms. Consider Fry's compound interest situation. To compute the amount A after a time t, we just plug in t to the exponential model A = .93(1.0225)t, but what if we wanted to know how long it would take for Fry's money to double or triple? Well, then we would need to solve the equations 2 = 1.0225t and 3 = 1.0225t. In the case of radioactive decay, using these ideas of solving for time given an amount becomes very useful when dating fossils: we measure how much carbon-14 is present, compare that to how much would have been present at the time of death, and then compute how long it would have taken for the original amount to decay to the observed amount. I'm pasting in a copy of a nice lab which explores this very application, and has the students date some skeletons found at a construction site. The lab is built off an example used by my office mate and fellow G-TEAMS fellow Victor Piercey in his college algebra classes.

There is still sizable resistance to the labs (or any form of work), but some students actually prefer the labs because of their application driven life blood. One student commented that they didn't really understand a topic until they did the corresponding lab, and that's precisely what motivates us to continue giving labs. The point is that if you can read, digest, synthesize, and explain a concept in context, then you have more than just a superficial understanding of the abstract properties. To me, the most important component of the labs is the student communicates their results back to us. Did they just write down a decimal answer with no explanation or did they interpret the units and write a complete sentence? There's a massive difference here in who gets it and who doesn't.
In calc, we've bulled ahead to mean value theorem, extreme value theorem, concavity, and so forth. Basically, we take derivatives (first and second) and see where the derivative vanishes or is undefined. When the first derivative vanishes, this means we have a horizontal tangent line since horizontal lines are precisely the lines with slope zero. Graphically, we can only have a horizontal tangent line when there's local extrema (min or max). However, there may be points on the graph of our original function which have smaller or larger y-values than any local extrema, but the function may not be differentiable there due to a cusp, corner, or break in the graph. We expect a lot from our calc class and we have a very long road to go before we're even close to ready for the AP exam. The plan is to get done with material soon enough to have several weeks in a row of nothing but exam prep. Even so, we need to start exam preparation early.
In stats, we've continued to use real world data intended to reinforce concepts in context, although as the year has worn on, it seems as if getting any effort from the students is like pulling teeth. This could be partly due to their expectations about this course and also the fact that the course is not needed for graduation. In any case, we're looking at a discrete distributions right now: binomial, geometric, and Poisson. In the binomial distribution we do something (flip a coin, roll some dice, etc) a fixed number n times, and we call it a trial each time we do it. If there's a probability p of success (say getting heads, rolling a six, etc) in any given trial, then the probability of getting exactly k successes in n trials is
P(k) = nCkpkqn - k
where q = 1 - p is the probability of failure (getting tails, not rolling a six, etc). Upon comparison with the binomial expansion of (x + y)n above, we see why we refer to this as a binomial probability distribution. Sure we can calculate probabilities with coin flips/dice rolling... or we can also use this discuss issues of discrimination or under-representation. How so? Well, assume a group of people represents a proportion p of the population of applicants for a certain position (let's say of power of influence). Then we can compare the observed proportion of this group in said position to p; specifically, we can compute the probability that only k or less members of a certain group showed up in a position with n slots. Take the Supreme Court of the United States as an example. See the slick seal below.

There have been only four women on the Supreme Court out of 112 justices. (Note that two of the four women were both appointed quite recently [2010] under Obama.) OK, the ratio of men to women fluctuates, but is roughly 1 to 1. That is, if we let p = 0.5 and n = 112, then we can add up the probabilities of getting k = 0, 1, 2, 3, or 4, women. So, using the above formula, what's the chances that we only ended up with 4 or less women on the Supreme Court assuming men and women were equally likely to be appointed? It turns out to be quite small of course, namely,
P(0) + P(1) + P(2) + P(3) + P(4) = 0.0000000000000000000000000012412751...
This is not so surprising, but analyzing a question like this brings up the discussion of why. Herein lies a key point of emphasis in critical thinking that we try to incorporate: just because the probability is small doesn't allow us to conclude anything about gender discrimination without first considering all confounding variables. There are a ton factors that could influence which judges become appointed and which do not. The fact that we've had all male presidents thus far certainly should be considered, for example. A more interesting question we can ask is "How many women should we have had on the Supreme Court by now?" The question as stated is too vague, but we can rephrase as follows. We say an event is "unlikely" when it has a probability of less than 0.05 of occurring. With this notation we can ask what the minimum number of women is to NOT be unlikely. Turns out that we would have needed at least 47 women on the Supreme Court to make the probability greater than 0.05. Of course, the expectation is 56, so we should have something "close to" that. It wouldn't be odd, for instance, to have had 59 or 51, but having only 4 is extremely unlikely if both men and women were equally likely to be appointed. Again, I cannot stress enough that this proves nothing about WHY we see this discrepancy.
I had nice winter break in Tennessee with my family, and I'm enthusiastic about getting back to work at Rincon. Over X-mas, the bathrooms (see above rant) were given a mild makeover. There are now soap dispensers at least, but the soap is watery and there are (again) rarely paper towels in the paper towel holders. We got new solid bathroom stalls, and it appears like the clogged urinals have been unclogged. Broken windows still exist (throughout the schoool), but that may be next on the agenda. In any case, things are better than they were, but could stand more love.
Meanwhile, the "persistantly low acheiving" label continues to trouble and distract the faculty, students, and others. Under the new guidelines, the lower five percent (according to recent AIMS scores) of each tier of schools comes under heavy scrutiny and (in our case at least) must be subjected to one of four unpleasant "models," any one of which could result in very talented, hard-working and devoted teachers being let go. Needless to say, there are many who wish to appeal the labeling, and, in particular, the tier location. When one compares Rincon to many similar schools in TUSD, one finds that Rincon has consistently (i.e., over the past ten years) outperformed them. Why then should Rincon be punished for having one sub-par year? Moreover, that was a year with a vacuum in leadership. In any case, we were told that appealing the label was futile unless we had a very good lawyer.
Politics aside, Charles and I have a lot going on this semester from an academic and G-TEAMS standpoint. First, Charles and I spoke at the annual MEAD (Mathematics Educator Appreciation Day) Conference this past Saturday (Jan. 22nd). I made a slide presentation for our session which can be found at this link. We discussed our philosophy of reinforcing the study of functions (in Precalculus) and distributions (in Statistics) by requiring students to read thoughtfully created labs and writing detailed lab reports. By digesting written material and synthesizing their own conlcusions, we feel that students gain more in terms of life skills than they would have just plowing through drill problems.
Charles and I may also be running a session in Washington D.C. at the annual GK-12 meeting. We'll definitely be displaying some of our work at the G-TEAMS Showcase this February.
In Precalculus, we began the new year by giving the students the "shortcuts" of finding derivatives which they had to do by hand (i.e., using the limit definition) last semester. It's a lot to absorb in such a short period of time (especially the correct implementation of multiple chain rules), but some have done quite well.
We also took a step back and revisited logarithms. The point here was to recognize that we measure earthquake intesity on a logarithmic scale because the differences among energy levels are so large (and small) that one cannot graphically compare their values on a linear scale. We gave our students a lab which analyzed earthquake magnitude and deaths from said disaster. Students noticed that there was not a nice correlation between deaths and magnitude: when one plaits the points, we see an apparently randow scattering. For example, on January 12th, 2010, Haiti had a 7.0 Mw magnitude earthquake. Over 90,000 died (and some estimate a much as 200,000) as a direct result of this disaster. Below is an image of the National Palace before and after.

The Mw represents the moment magnitude scale, used for inordinately large earthquakes. Specifically,
Mw = (2/3)log10(ES) - 7.5
where the energy ES measures the destructive power.
Ironically, a couple of weeks later, a magnitude 8.8 Mw earthquake struck Chile on January 27th, 2010.
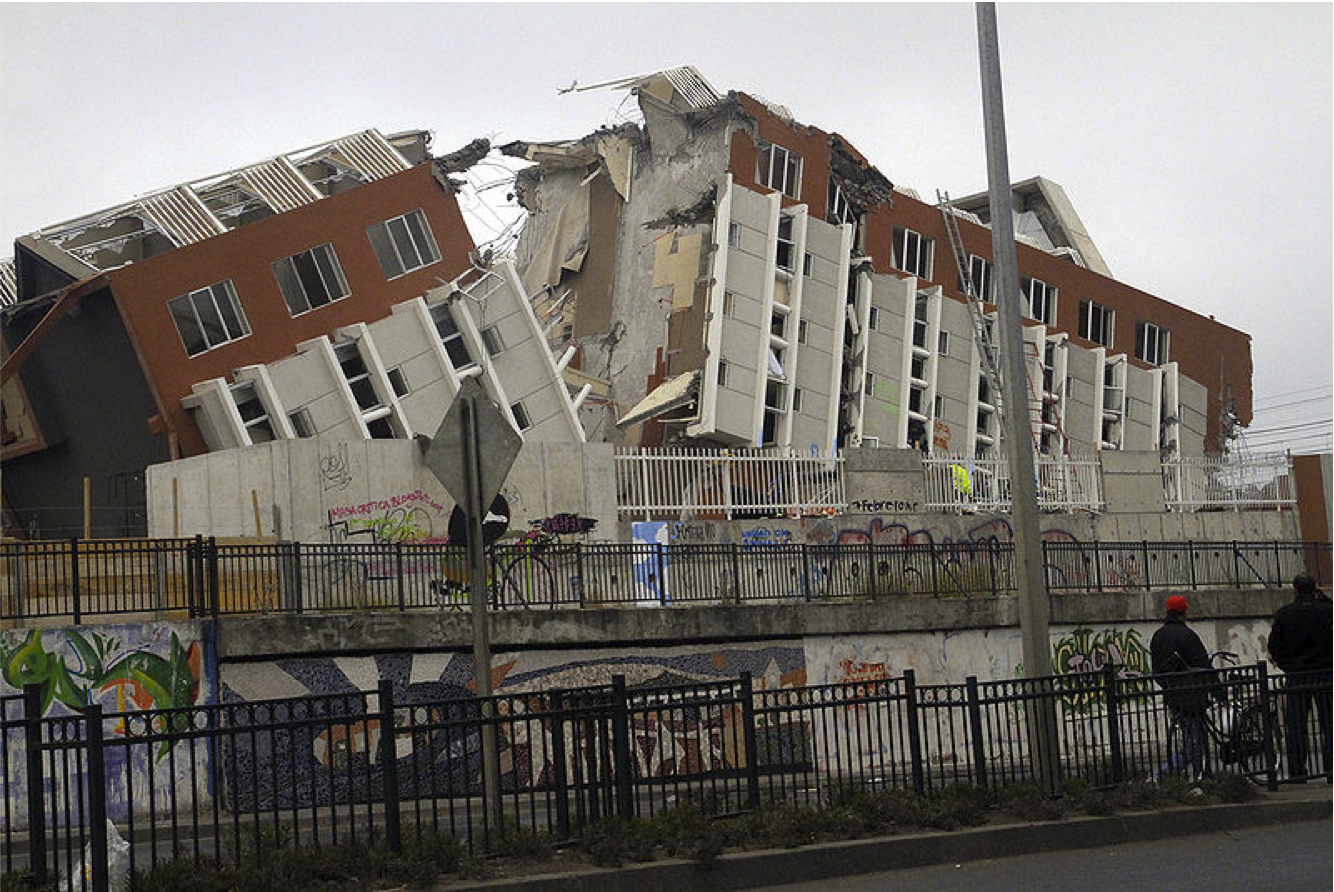
However, in this case there were only 521 dead in spite of the fact that the energy was
10(3/2)(8.8-7.0) ≈ 501.2
times as strong. Students realized that there were tons of factors (other than the magnitude) which contributed to the death toll. For example, some factors include infrastructure, emergency response capability, population density, and economy size. In fact, when students plotted the the numbers of deaths with respect tp the magnitude for roughly 40 earthquakes, they found no correlation (i.e., the plot looked like a bunch of scattered points).
In A.P. Calculus, we've begun our journey into integral calculus. Long story short, the definite integral from a to b of a (continuous) function f(x) is the area A between the graph of f and the x-axis bounded by the vertical lines x = a and x = b...
∫[a, b] f(x) dx = stated area A.
One can think of the integral as a sum: basically, we're adding up all the areas of little rectangles of an infinitesimal width dx and of height a function value. In fact, the integral sign is shaped like an "S" (for sum) for that very reason. If we wanted to find the mean (average) for finite set of values, we would add them up an divide by the total number of said values. Analogously, if we want to find the mean value of our function f(x) over the interval [a, b], then we take the area A given by the integral and divde by the length b - a of the interval. Since this mean value should be bounded by the minimum and maximum of f on this interval, we have the inequality
(b - a)min(f) ≤ A ≤ (b - a)max(f).
Moreover, there should be a point c between a and b at which (b - a)f(c) = A; this is known as the mean value theorem for integrals, and it's illustrated below.
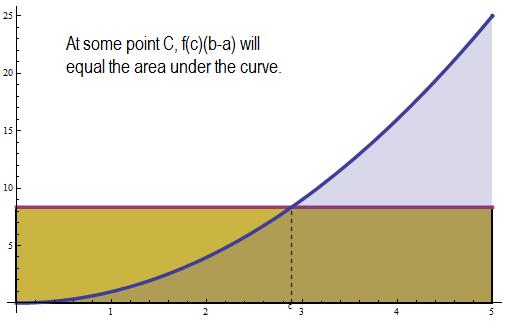
The way I tried to explain this to the students was to think of the blue area A as a sheet of ice (in an interesting shape). Then if we melt this sheet, the resulting water would fill up some space above the x-axis bound by x = a and x = b in the shape of a rectangle (the yellow area). The height of this rectangle is some function value f(c).
We also discussed a visual representation of the fundamantal theorem of calculus as seen below.

The picture suggests that
f(x) ≈ (A(x + h) - A(x))/h ≈ A'(x)
for small values of h. The upshot here is that A(x) is the integeral of f from 0 to x, so
f(x) = (d/dx) ∫[0, x] f(t) dt
This allows us to "undo" integration with differentiation and vice versa up to an additive constant (since adding a constant to a function will not change its derivative).
Oh gracious! There's a ton to spill here. First, all the teachers, adminstrators, and staff, at Rincon have been fired (effecetive at the end of this spring semester). That's right, the superintendant John Pedicone and his assistant Edith Macklin-Isquierdo recommended that the school board choose the "turnaround model" as opposed to the "transformation model" in a hugely important meeting on February the 8th, 2011. Here is a link to the audio recording of that meeting. The "call to the audience" at the beginning of the meeting includes an emotional outpouring from Rincon teachers, parents, and students, begging the school board to use their heads and hearts in deciding upon the fate of a school and community. My teacher partner Charles Collingwood spoke during the call to audience as did some of my students. The statements they made at that meeting (as well as the meeting held at the high school itself) were sharp, well thought out, and logical. I urge anyone who reads these words to please listen to the part of the audio which includes their voices. Otherwise, their voices won't be heard at all... that's the message that the school board sent when they voted to fire everyone on the basis of highly questionable arguments (that is, arguments focuing on AIMS scores and not taking extenuating circumstances into account). The vote was 3 to 2 in favor of axing the employees rather than giving the school the funding it so desparately needed and working with the strenghes already present in the school.
Here's the deal: Rincon badly craved a principal, a strong leader in the wake of Principal Kim Babeu's administration, which took Rincon into a downward spiral of low academic performance. See this article, which gives a glimpse into the trouble brewing a year ago. RHS was not appointed a principal, in fact; rather, they were left to flail with an interim. The district really should have helped Rincon appoint a new principal and a grant writer. Seems like a pretty crucial component to the success of a high school.
Some info about the turnaround at Rincon can be found on the TUSD website here. There you'll find the arguments in favor of the model as well as some timelines involved. Here's a link to an article arguning that the turnaround at Rincon and Palo Verde was the wrong approach. Here's a wonderful article at Three Sonorans which has video of the school board meeting, showing Charles in particular. Please watch, please listen, please use your head. What has happened and is happening in TUSD regarding the undervaluing of educators (and treating them like dirt quite frankly) is deep and disturbing.
In March 2011, Charles and I went to Washington, DC, to attend and present at the National GK-12 Meeting. We were very fortunate that there was ample time to explore the city on foot...
This a nice corner time lapse with the capital building peeking out from behind the trees.

Here's a shot of me that Charles took against my will at the National Air and Space Museum.
Charles and I really tried to soak up as much museum time as possible, but we would have needed a solid week to even come close to taking it all in. I felt like this trip renewed our energy and truly inspired us. In fact, after visiting the United States Holocaust Memorial Museum and spending a great deal of time in the Nazi propaganda exhibit, I got the idea of doing a Math Appreciation Day (see below) on various topics related to World War II like fairness (or the lack thereof) in voting systems and how Polish mathematicians used permutation theory to first crack the Enigma cipher machine.
"I have a dream." - Charles, the Lincoln Memorial at night.
The green button Charles is wearing says "Save GK-12," and, in fact, as many of us found out in Washington, the NSF is indeed ending the entire GK-12 program. As it is, GK-12 puts graduate students in K-12 classrooms and has been wildly successful on many levels. Also, it did have a good run of more than a decade. Even so, the powers that be decided that the program did not enhance the research of the graduate students involved. We should note, however, that most of the students in the program would disagree with that assertion and, moreover, that was never an objective of the program anyway. Suffice to say, this made the trip bittersweet. I'm so grateful for the opportunity, but I'm very ashamed that our government simply does not recognize the need to build bridges from K-12 to the Universities. Indeed, K-12 education is in serious need of a makeover, and the positions are so undesirable (since we as a nation treat our teachers like dirt) that many potentially wonderful hires seek employment elsewhere. Why would one take a job where they are maximally undervalued? The ending of the GK-12 program is just another painful reminder that we must change our priorities or face the dire consequences of our next generation being unable to compete in the global market due to a lack of discipline in their education.
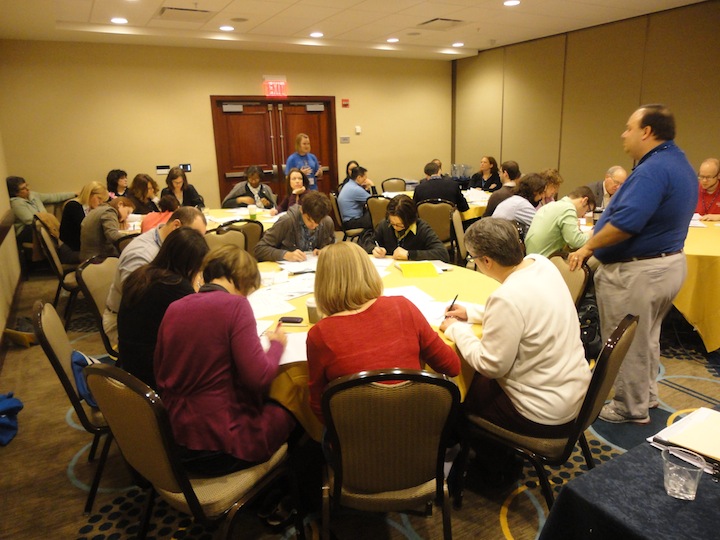
Here's one of Victor and Cassidy, another G-TEAMS pair, whom we presented with in our session on income inequality.
You can find the power point of the slides we used here. The session went well; we had good audience interaction and incorporated technology in our activity. Later, we used one of the worksheets in our own class during our Gini activity as a template for a class project.
The Spring 2011 Semester afforded me the precious chance to have entire class periods devoted to enjoying the more interesting instances of math in our lives: art, literature, history, physics. I gave slide presentations on various topics which I though would appeal to a wide and wild audience. Charles and I felt that these talks tied in to our overall theme of changing the perception of mathematics. Of course, we feel that it's imperative for any college bound student to have the basic academic discipline and skills necessary to succeed in math and life, and in technical fields mathematics has proven to have myriad applications. However, we should also take time to truly appreciate the beauty and deeper philosophical implications of the subject. It is this beauty that drives mathematicians; it's not generally the application of a theorem which inspires us, but rather the formulation and proof thereof are the gas and sparks. As it so happens, there are ways of sharing some if these cherished abtract ideas in ways that are both comprehensible and entertaining.
The first talk I gave concerned several paintings by M.C. Escher and Salavdor Dali which demonstrate (with pleasant illustration) some interesting mathematical concepts.
|
|
The painting to the left is part of Escher's 'Circle Limit' series and it illustrates, quite beautifully I might add, a model for hyperbolic geometry. This geometry satisfies all the rules of Euclidean (flat) geometry except one called the "parallel postulate". Mathematicians spent centuries trying to prove that the parallel postulate shouldn't be a rule at all, i.e., they tried to show it followed from the other rules. These attempts were futile, however, because there existed other geometries (hyperbolic and spherical) which did not satisfy the parallel postulate. In the painting, you should consider all fish to have the same length; here you should think of two buildings of the same size but at different distances away from you. In other words, the disc in not in a sense flat, but rather some fish are closer to you and thus appear larger than others. We can see that this represents a different geometry by looking at a single vertex where six fish come together. If we naively add up the interior angles we get more than 360 degrees! Of course, in adding up the angles we assumed (incorrectly) that the interior angles of a triangle always add up to 180 degrees. In fact, in hyperbolic geometry, the sum of the interior angles of a triangle is less than 180 degrees. You can find a link to the slides for this talk here (please download and open with adobe). |
The Victorian era saw advancements in medicine, prosperity in industry for England, and 'symbolic algebra'. De Morgan's Trigonometry and Double Algebra typified this new approach to algebra by performing purely symbolic manipulations without an "atom of meaning". Some conservative mathematicians of the era like Charles Dodgson (better known as Lewis Carroll) weren't so found of pushing notation around without a solid physical interpretation.
|
|
Although Alice's Aventures in Wonderland started out as a purely whimsical tale Dodgson spun out on a rowing trip to keep Alice Liddell and her sisters entertained, the author later added in hidden and humorous critiques of modern mathematics. One of the most interesting example of this concerns the famous mad tea party. To compute scaling and rotations in a plane (two dimensions), we can use multiplication by complex numbers which have two components (a real one and an imaginary one). The mathematician William Hamilton found an extension of the complex numbers called the quaternions which allow one to compute scaling and rotations in three dimensions. However, the quaternions have four components and any attempt get away with using only three components will fail. This is related to Gimbal lock. Turns out that the Mad Hatter, March Hare, and Dormouse, are stuck rotating around the table (i.e., stuck rotating in a plane as opposed to 3D rotations) because they are missing Time, the fourth component in the quaternions as it was understood by some of the era. You can find a link to the slides for this talk here (please download and open with adobe). |
Topology is, roughly speaking, the study of geometric properties and spatial relations unaffected by the continuous change of shape or size of figures. Manifolds are particularly nice objects of study within topology (because we can do calculus on them) which have the property that they are 'locally flat'. In the case of two-dimensional manifolds like a sphere or torus, the object as a whole is not flat, but looks flat in a small neighborhood around each point (consider the Earth). General Relativity is the idea that gravity can be modeled as heavy objects bending space-time (a 4D manifold). Einstein described precisely how matter bends the fabric space-time.
|
|
The Möbius strip is the surface (two dimensional manifold) one can make a model of by taking a stip of paper, twisting it, and then taping the ends together to get a 'one-sided' object. The picute to the left is a glass Klein bottle which is, in a sense, a tubular Möbius strip. The Klein bottle also has only one side (the technical word for which is 'non-orientable'). What is the geometry of universe? Could we be living in a higher dimensional version of an object which wraps around itself? You can find a link to the slides for this talk here (please download and open with adobe). |
Mathematics has played an important role in how we vote, distribute seats in congress, and (de)code secret messages.
|
|
To the left is a picture and diagram of a German Enigma machince that the Nazis used to send messages secretly during World War II. Polish mathematicians found the first cracks in the machine, and British mathematicians at Bletchley Park continued to break the Nazi ciphers and ultimately helped to win the war for the allies. Some results about the theory of permutation groups were key in this effort. You can find a link to the slides here (please download and open with adobe) |
The area of mathematics known as number theory has some of the oldest and most celebrated unsolved problems. Of these open questions, the Riemann hypothesis stands out as the most coveted and would bring instant fame (not to mention a million dollar prize) to the first person who proves it. This conjecture dates back to the late 1850's and concerns the Riemann zeta function ζ(s), which is a meromorphic function (of a complex variable s) that contains deep inrofmation about the distribution of the primes numbers 2, 3, 5, 7, 11, 13, 17, 19, 23, 29, 31, 37, ... . The conjecture states that all the non-trivial zeros of ζ(s) occur when s is of the form 1/2 + ib where i is the imaginary unit and b is a real number. If s = a + ib with a greater than 1, then ζ(s) = 1/1s + 1/2s + 1/3s + 1/4s + ⋅⋅⋅, but this sum is infinite elsewhere in the complex plane.
|
|
Srinivasa Ramanujan was an Indian mathematician who easily ranks as one of the greatest minds of all time. At times he lived in poverty and, as paper was scarce, only recorded his final calculations. He filled up four 'notebooks' with line after line of results which launched whole new areas of math along with the careers of those who tried to verify the beautiful identities they found. Ramanujan was a master of assigning numerical values to divergent sums. He once told the British mathematician Hardy that the infinite sum 1 + 2 + 3 + 4 + ⋅⋅⋅ = -1/12 (that's right, he claimed the sum of all the positive integers taken consecutively was equal to minus one twelfth). Herdy knew that Ramanujan did not belong in an asylum, but rather working in the University next to him. In fact, what Ramanujan was computing was a special value of the Riemann zeta function mentioned above, namely, ζ(-1) = -1/12. Had Ramanujan not passed away so early, he may have very well proven the Riemann hypothesis himself. You can find a link to the slides for this talk here (please download and open with adobe). |
One of the last major projects Charles and I did with our PreCalc students was a group project in which teams competed to build the best satellite dish. First, we reviewed quadratic equations and the language of parabolas: focus, directrix, line of symmetry, and so on. Then we expained why satellite dishes were parabolic in shape. Next, we divided up our sections and turned the kids loose to design a dish, make a brochure, construct a prototype, build a full scale dish, give a power-point presentation, test the dish, and turn in a paper documenting their choice of equation, materials used, difficulties overcome. Here you'll find a power point description of the project, and here is a link to the pdf I made for the calculus component of the project. This project could be (and has been) done, of course, in an Algebra II class, but we wanted the students to do something hands on. We recognized that there were calculus aspects to to project as well. For instance, the angle of reflection of a beam on a curved surface can be computed by looking at the tangent line on the point of impact. For a parabola, any incoming vertical beam will be reflected through the focus.
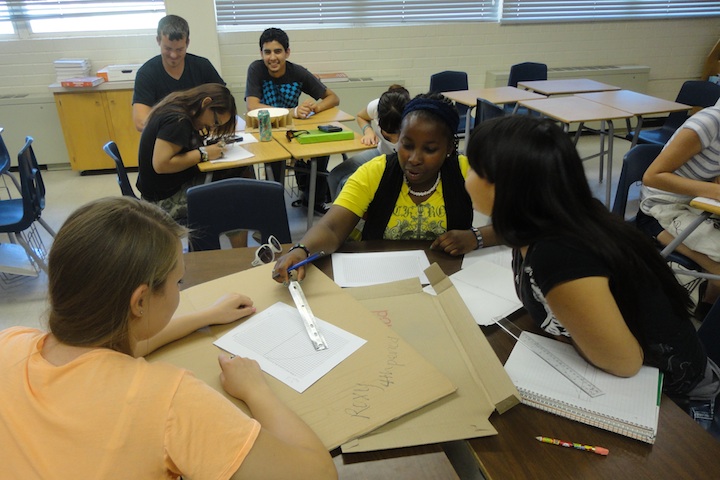
These are students making measurements in class for their model.
We stressed that the more accurately and carefully teams calculated their template parabola, the better they would fair in the judging of their efforts. Of course, a huge part of the project also has to do with taking an abstract model (the chosen quadtratic), and making it real from hard paper materials. This naturally brought up all kinds of things you discuss but are better left to self discovery, like, for example, the fact units matter a bunch (as in 'are we using inches or centimeters?') and how to scale up a small model into a larger one.
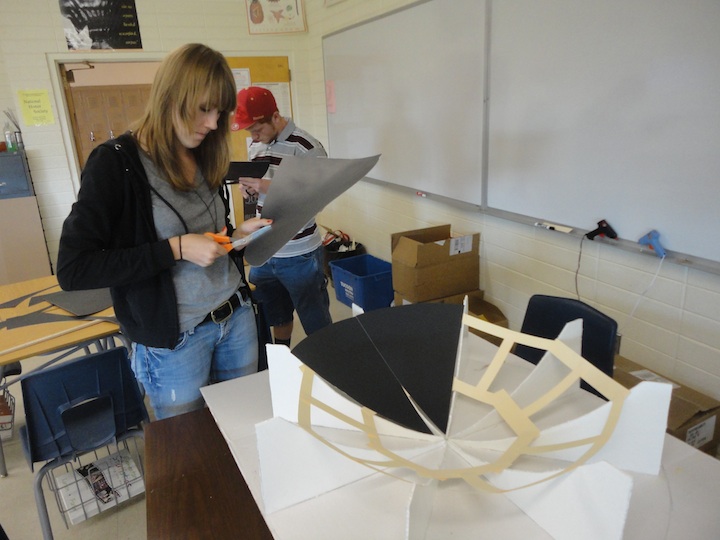
Here are some students constructing their full scale dish.
I saw this phase as a chance to interject a little more calculus into the content: when students were measuring flaps to fit over their skeleton parabolas, they wanted to know how long to cut them. I told them this was an arc length problem, and I showed how they could plug the derivative of the function into the arc length formula and use their calculators to compute the integral numerically.
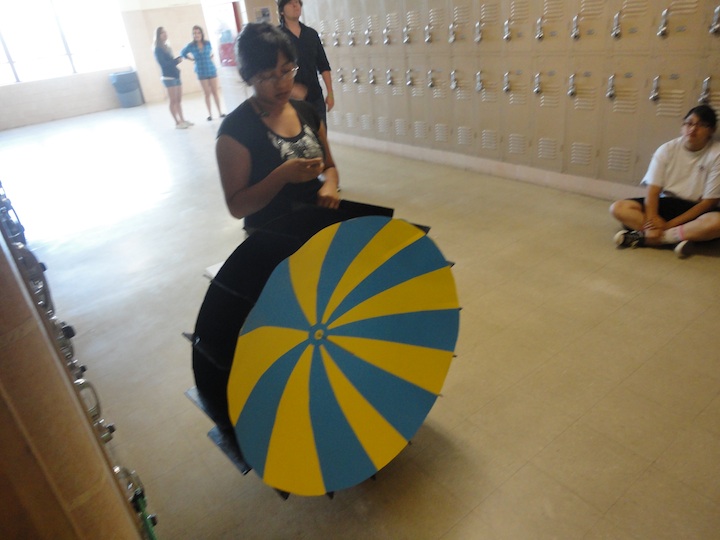
This is a student in the hallway adjusting the volume on her iPod to test her team's dish.
The idea of testing the dishes in the hallway was Charles', and it really drove home the utility of their efforts. Students would direct their dishes towards the end of the hall and intermittently play music into the dish. Another student would gradually move down the hallway with their back turned to the dish and hold up an arm when they heard the projection of sound waves from the dish. Needless to say, there came a point where the student was no longer able to hear the music unless it was being projected out from the dish... the better shaped the dish, the better the sounds were directed.
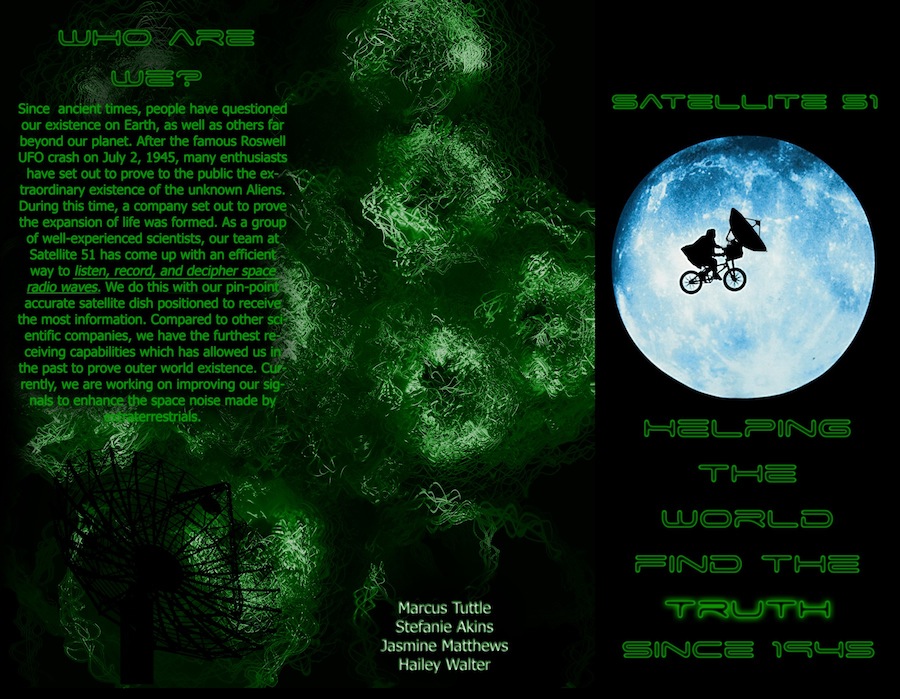
This is the front of a tri-fold brochure made by some of our students.
We felt like the pamphlets made gave the kids a chance to be creative and also collaborate on how best to breifly but accurately encapsulate how and why parabolas show up in both the design of satellite dishes and elsewhere.
This is the back of the above brochure.